In this post, I want to look at how to use a few of the built-in Qlik GeoAnalytics functions that will allow us to manipulate and aggregate geographic data.
Specifically, we are going to look at how to calculate a bounding box for several grouped geographic points, reformat the result, and then calculate the centroid of those bounding boxes. This can be a useful transformation step when our data has geographic coordinates that you need to have aggregated into a single, centered point for a particular grouping.
In our example, we have a small dataset with a few records pertaining to Florida locations. It includes coordinates for each Zip Code that is within the city of Brandon. Our goal is to take those four coordinates, aggregate them into a single, centered point, and then return that point in the correct format for displaying it in a Qlik map object.
Here’s our data, loaded from an Inline table:
[Data]:
Load * Inline [
State   ,   County          ,   City            ,   Zip     ,   Lat         ,   Long
FL      ,   Hillsborough    ,   Apollo Beach    ,   33572   ,   27.770687   ,   -82.399753
FL      ,   Hillsborough    ,   Brandon         ,   33508   ,   27.893594   ,   -82.273524
FL      ,   Hillsborough    ,   Brandon         ,   33509   ,   27.934039   ,   -82.302518
FL      ,   Hillsborough    ,   Brandon         ,   33510   ,   27.955670   ,   -82.300662
FL      ,   Hillsborough    ,   Brandon         ,   33511   ,   27.909390   ,   -82.292292
FL      ,   Hillsborough    ,   Sun City        ,   33586   ,   27.674490   ,   -82.480954
];
Let’s see what happens when we load this data and create a new map that has a point layer, using City as the dimension and the Lat/Long fields as the location fields:
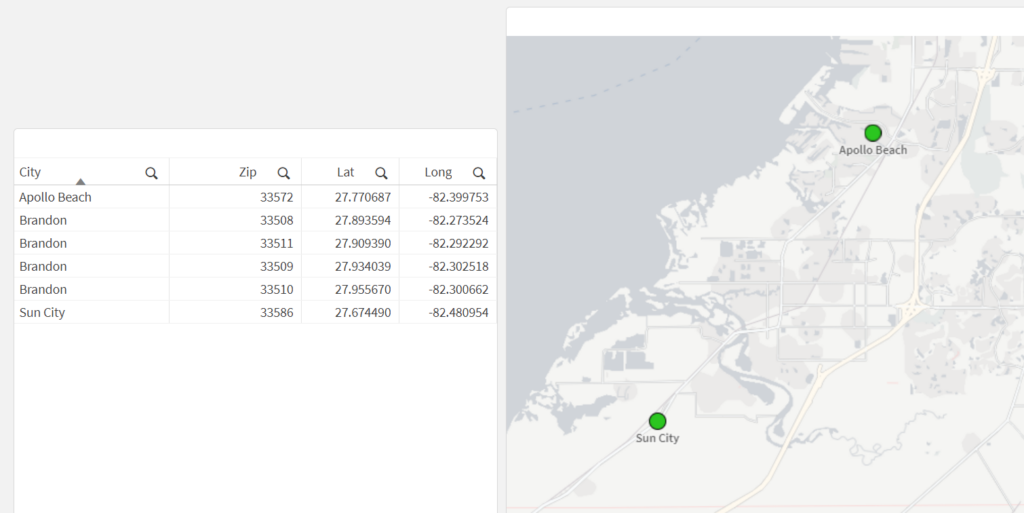
What we may notice here is that the city of Brandon does not show up on the map — this is because the dimensional values for the point layer need to have only one possible location (in this case, one lat/long pair). Since Brandon has multiple Lat/Long pairs (one for each Zip Code), the map can’t display a single point for Brandon.
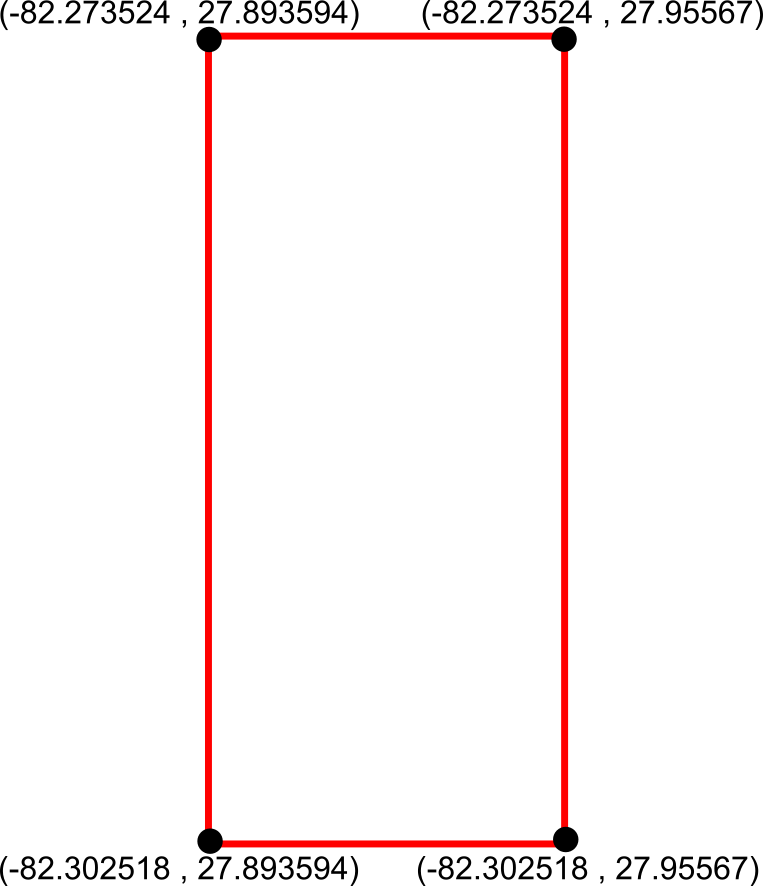
Okay, so let’s get the bounding box so that we can use it to get the center-most point. This is ultimately what we want our bounding box to be:
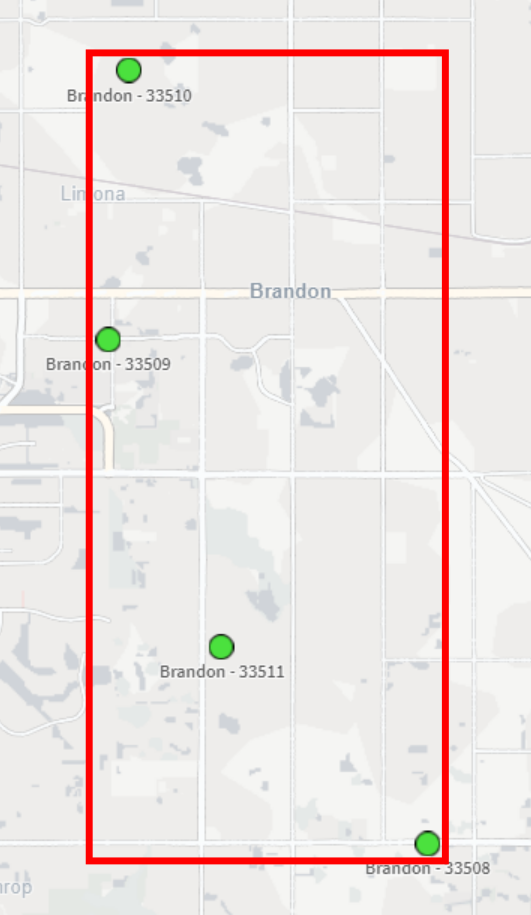
To do this in Qlik we’ll use the GeoBoundingBox() function, which calculates the smallest possible box that contains all given points, as shown in the example image above.
Here’s the script we can use in the Data Load Editor:
[Bounding Boxes]:
Load
    [City]
  , GeoBoundingBox('[' & Lat & ',' & Long & ']') as Box
Resident [Data]
  Group By [City]
;
That results in this:
| City | Box |
| Apollo Beach | {“qTop”:-82.399753,”qLeft”:27.770687,”qBottom”:-82.399753,”qRight”:27.770687} |
| Brandon | {“qTop”:-82.273524,”qLeft”:27.893594,”qBottom”:-82.302518,”qRight”:27.95567} |
| Sun City | {“qTop”:-82.480954,”qLeft”:27.67449,”qBottom”:-82.480954,”qRight”:27.67449} |
Alright so we now have our bounding boxes for our cities, but we can’t use those points quite yet — right now we just have the top, left, right, and bottom points separately:
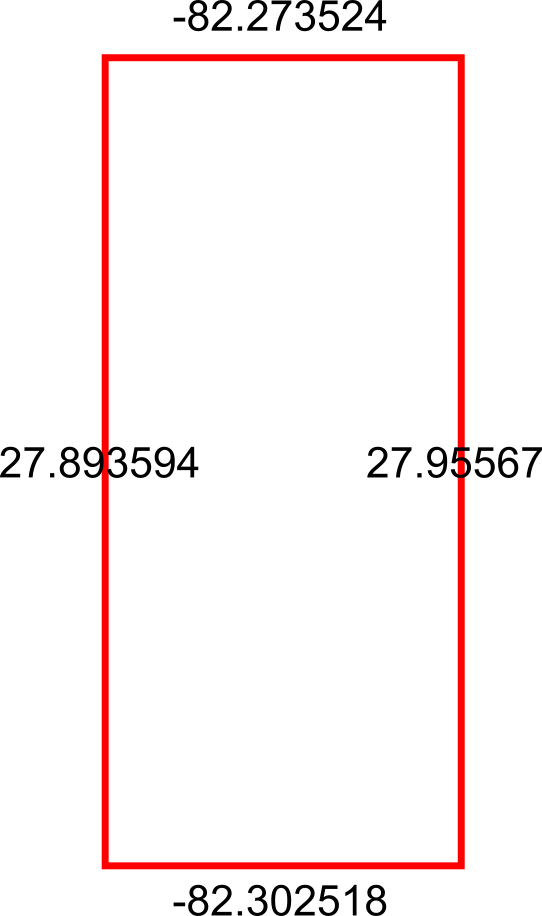
What we need to do is reformat those points into actual coordinates for the bounding box, like so:
We can achieve this by using the JsonGet() function, which can return values for specific properties of a valid JSON string. This is useful to us because the GeoBoundingBox() function we used before returns the top, left, right, and bottom points in a JSON-like string that we can easily parse for this step.
Here’s the Qlik script we can use to parse those points into actual coordinates:
[Formatted Box]:
Load
    [City]
  , [Box]
  , '[['
    & JsonGet([Box], '/qTop') & ',' & JsonGet([Box], '/qLeft')
    & '],[' & JsonGet([Box], '/qBottom') & ',' & JsonGet([Box], '/qLeft')
    & '],[' & JsonGet([Box], '/qBottom') & ',' & JsonGet([Box], '/qRight')
    & '],[' & JsonGet([Box], '/qTop') & ',' & JsonGet([Box], '/qRight')
    & '],[' & JsonGet([Box], '/qTop') & ',' & JsonGet([Box], '/qLeft')
    & ']]' as [Box Formatted]
Resident [Bounding Boxes];

Drop Table [Bounding Boxes];
This results in correctly formatted bounding box coordinates:
| City | Box Formatted |
| Apollo Beach | [[-82.399753,27.770687],[-82.399753,27.770687],[-82.399753,27.770687],[-82.399753,27.770687],[-82.399753,27.770687]] |
| Brandon | [[-82.273524,27.893594],[-82.302518,27.893594],[-82.302518,27.95567],[-82.273524,27.95567],[-82.273524,27.893594]] |
| Sun City | [[-82.480954,27.67449],[-82.480954,27.67449],[-82.480954,27.67449],[-82.480954,27.67449],[-82.480954,27.67449]] |
So now that we have these coordinates, we can aggregate the box coordinates into a center point using the GeoGetPolygonCenter() function, which will take the given area and output a centered point coordinate.
Here’s the script we can use for this:
[Centered Placenames]:
Load *
  , KeepChar(SubField([City Centroid], ',', 1), '0123456789.-') as [City Centroid Long]
  , KeepChar(SubField([City Centroid], ',', 2), '0123456789.-') as [City Centroid Lat]
;
Load
    [City]
  , GeoGetPolygonCenter([Box Formatted]) as [City Centroid]
Resident [Formatted Box];

Drop Table [Formatted Box];
This will result in the center points for each city. We also split out the Lat/Long fields into separate fields for easier use in the map:
| City | City Centroid | City Centroid Lat | City Centroid Longitude |
| Apollo Beach | [-82.399753,27.770687] | 27.770687 | -82.399753 |
| Brandon | [-82.288021,27.9094739069767] | 27.9094739069767 | -82.288021 |
| Sun City | [-82.480954,27.67449] | 27.67449 | -82.480954 |
And now we can view our city-centered points on a map:
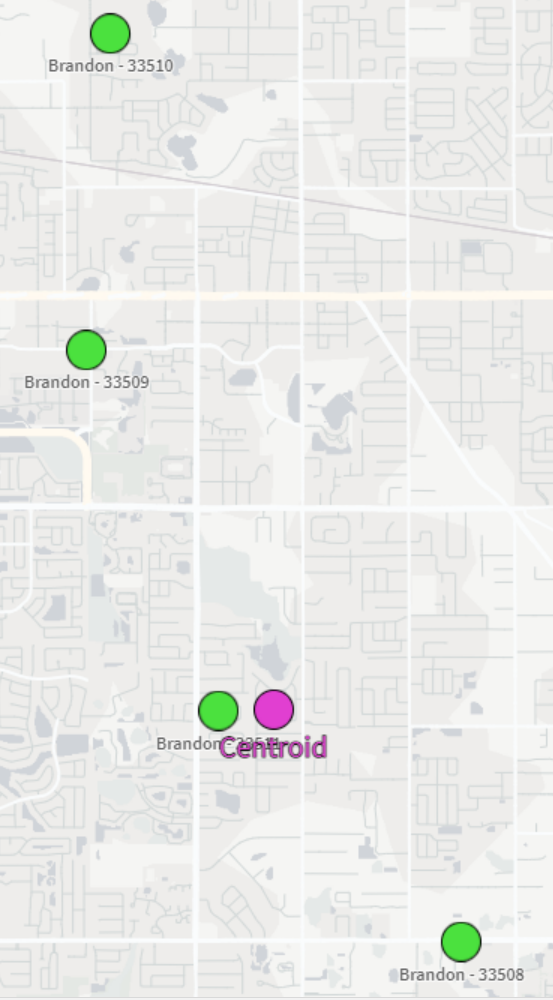
And there we have it! It’s not the perfect centering we may have expected but that could be due to the map projection that we’re using or the specificity of the coordinates we chose. Either way, this is a great way to be able to aggregate several coordinates down to their center point.