Vizlib for Qlik: Supercharge Your Analytics
Transform your Qlik environment with Vizlib’s powerful, intuitive extensions—designed to help your team move from data reporting to true data storytelling.
Why Vizlib?
At Arc Analytics, we help organizations unlock the full potential of Qlik. Vizlib’s suite of value-added products extends Qlik’s native capabilities, making it easier to visualize, collaborate, and act on your data. Whether you’re in healthcare, education, government, or the private sector, Vizlib empowers your team to deliver insights faster and drive better outcomes.
How Vizlib can help your organization get more from Qlik?
Vizlib Product Suite
Vizlib Library
The most powerful dashboarding and visual analytics toolkit for Qlik.
- No-code, intuitive design: Build advanced dashboards and visualizations without writing code, saving development time and reducing project costs.
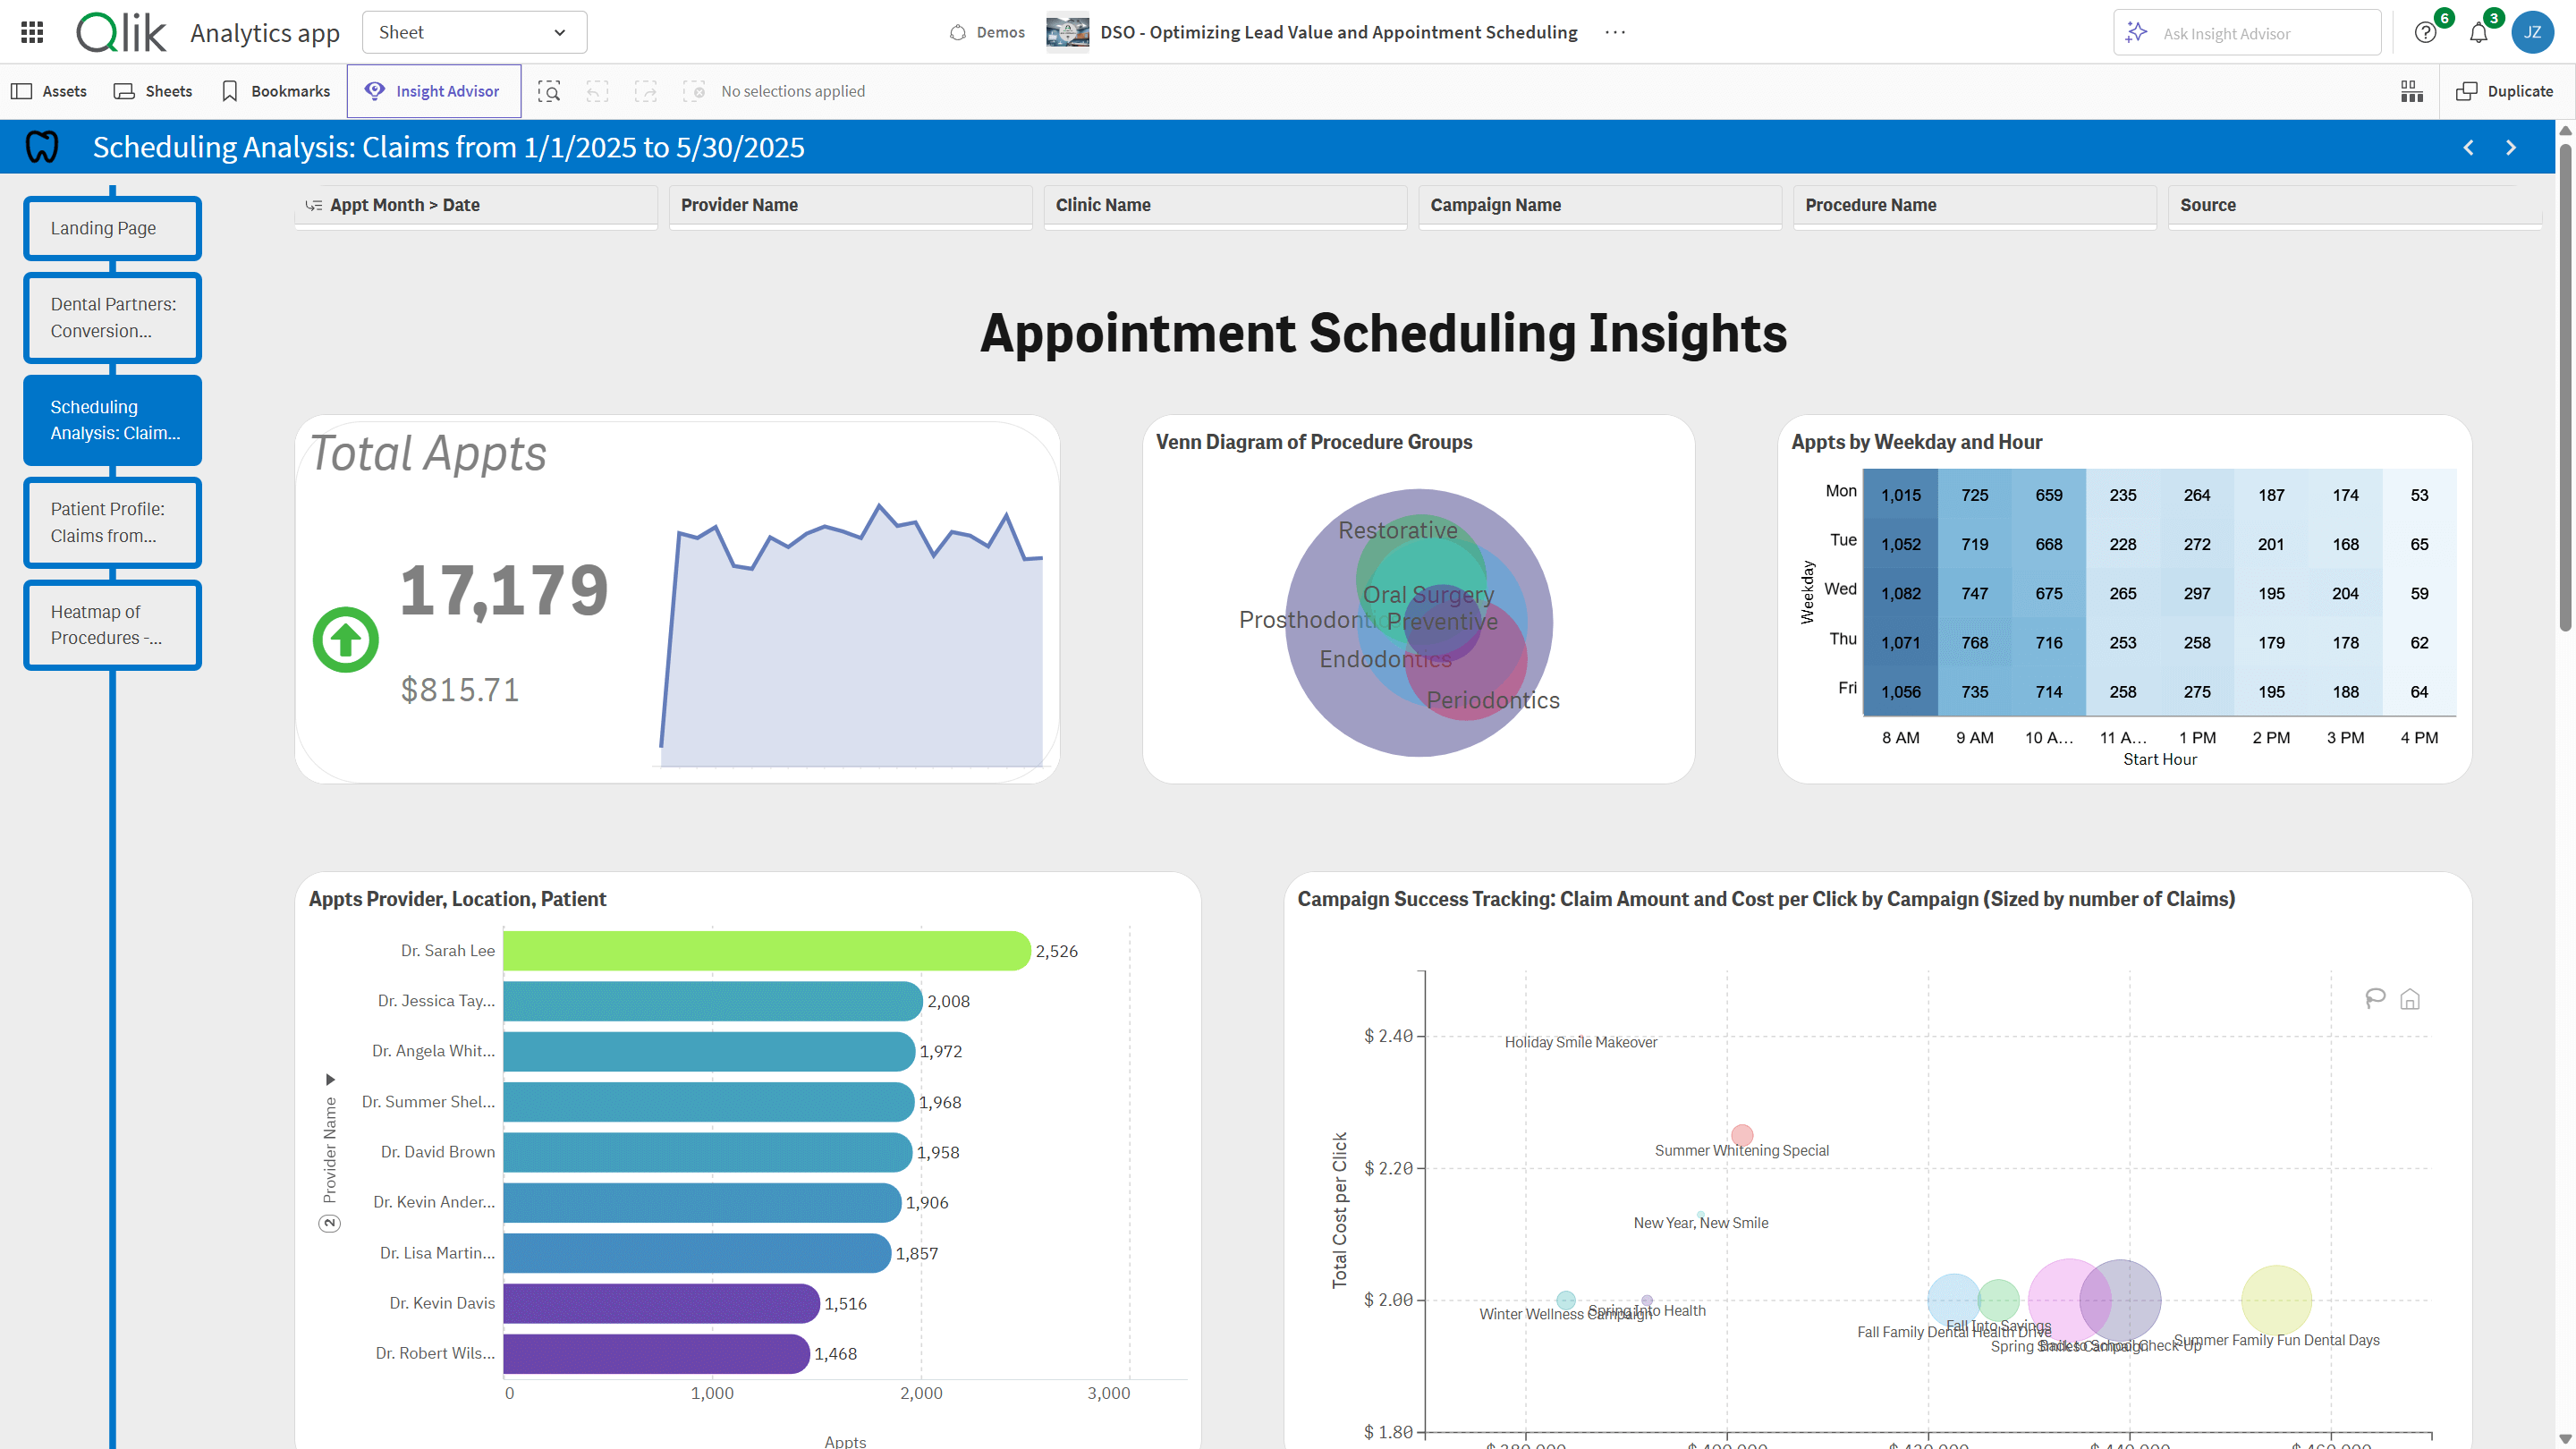
- Essential and advanced charts: From bar, pie, and line charts to heatmaps, waterfall, and Venn diagrams—Vizlib Library covers all your visualization needs.
- Customizable UX components: Enhance user experience with interactive buttons, switches, and navigation tools.
- Advanced analytics: Run forecasts and cluster analysis directly in Qlik, helping you make strategic decisions with confidence.
- Templates and actions: Standardize your dashboards with reusable templates and guide users with custom actions and workflows.
Vizlib Finance
Make it easy for finance teams to build, analyze, and share interactive financial statements—without the headaches of manual spreadsheets.
- Ease-of-use: Instantly create interactive Profit & Loss statements and balance sheets with out-of-the-box templates—no coding required
- Drill down: From high-level overviews to transaction-level detail for deeper financial analysis
- Built-In Approvals: Real-time commentary and collaboration directly within reports, streamlining team communication and approvals
- Export: Seamless export to Excel, preserving all formatting for easy sharing and compliance
- Error Reduction: Reduces manual processes and spreadsheet risk, saving time and boosting data trust
Vizlib Self-Service
Empower business users to explore data independently—no IT bottlenecks.
- Self-service analytics: Let users create their own reports, dashboards, and visualizations with easy-to-use tools.
- Tiles and toolbars: Organize KPIs, product lists, or customer data in visually engaging tiles. Add toolbars for quick selections, filters, and actions.
- Boost data literacy: Make analytics accessible to everyone, increasing adoption and driving a data-driven culture.
Vizlib Gantt
Plan, track, and visualize projects with interactive Gantt charts.
- Project management made easy: Map out timelines, milestones, and dependencies for any industry—healthcare, construction, consulting, and more.
- Real-time updates: Keep teams aligned with up-to-date project views and progress tracking.
- Flexible and customizable: Adapt Gantt charts to your unique workflows and reporting needs.
Vizlib Collaboration
Bring your team together inside Qlik.
- In-app collaboration: Add comments, share insights, and capture feedback directly within your dashboards.
- Streamline decision-making: Keep conversations and context tied to your data, so nothing gets lost in email threads or chat apps.
- Secure and governed: Maintain full control over data access and collaboration permissions.
Real Results: Trinity Life Sciences Case Study
Trinity Life Sciences used Vizlib to deliver a seamless, interactive analytics experience for their clients—boosting adoption, reducing project delivery times, and lowering costs. With Vizlib, they were able to offer advanced features like layering, custom tooltips, and dynamic search, all within a single Qlik tab. The result? Happier clients and more efficient teams.
Ready to See Vizlib in Action?
What Sets Vizlib Apart?
Faster time-to-insight: Go from raw data to actionable dashboards in record time.
Seamless integration: All Vizlib products are designed for Qlik and work with your existing environment—on-premise or cloud.
Fully supported: Arc Analytics provides expert implementation, training, and ongoing support for Vizlib solutions.
Flexible licensing: One license covers all Vizlib extensions for each user, whether they’re a developer or end user.
Free trial available: Try Vizlib free for up to 5 users.
Frequently Asked Questions
Have additional questions? Fill out the form below to schedule a call.
Does Vizlib work with Qlik mashups and nPrinting?
Yes, all Vizlib extensions are compatible.
Can I purchase individual extensions?
Vizlib is licensed by product suite, not by individual extension.
Is Vizlib secure?
Yes, Vizlib follows Qlik’s security model and supports enterprise-grade governance.
