State and local government agencies face a difficult choice in 2026. Many departments still run on software and hardware from ten or twenty years ago. These systems are often called legacy systems. While it might seem cheaper to keep using what you already own, the truth is the opposite. Staying on old platforms is actually more expensive and more dangerous than moving to something new.
When an organization uses outdated technology, they pay a hidden tax every single day. This tax comes in the form of slow work, high repair bills, and the constant fear of a system crash. Modern platforms like Qlik Cloud have changed the math. Today, moving to the cloud is the safest way to protect public funds and keep services running for citizens.
The Real Price of Legacy Systems
Many leaders think that keeping an old system saves money because there is no new purchase price. However, the cost to keep an old system running grows every year. In 2026, the parts needed for old servers are hard to find. The power needed to run old data centers is expensive. Most importantly, the people who know how to fix these systems are retiring.
When the only person who knows how to fix a critical database leaves, the agency is in trouble. Hiring a specialized consultant to fix an old system can cost three times more than a modern staff member. This creates a situation where the government is spending more money just to stay in the same place.
Comparing Costs: Old vs. New
To understand why Qlik Cloud saves money, we have to look at where the money actually goes. Legacy systems have many “invisible” costs that do not show up on a single receipt.
Expense Category
Legacy On-Premise Systems
Qlik Cloud Modernization
Hardware
High costs for servers and cooling
Zero hardware costs
Maintenance
Constant manual patching and fixes
Automatic updates by Qlik
Staffing
Requires rare, expensive specialists
Uses standard modern data skills
Security
High risk of gaps in old software
Enterprise-grade cloud security
Speed
Days or weeks to get a new report
Minutes to see live data
As the table shows, the shift to Qlik Cloud removes the heavy lifting of physical hardware. This allows the budget to go toward actual data analysis instead of just keeping the machines plugged in.
The Risk of Technical Debt with Legacy Systems
Technical debt is a term for the work you skip today that you will have to pay for later with interest. For a local government, technical debt looks like a pile of old software that no longer talks to new programs. In 2026, data needs to move fast. If a city needs to track emergency response times or school budgets, they cannot wait for an old system to “crunch the numbers” overnight.
Old architecture is also a target for cyber attacks. Hackers look for old systems because they are easier to break into. A single security breach can cost a county millions of dollars in legal fees and recovery. When you look at it this way, the “free” old system is actually a massive financial liability.
The Danger of Knowledge Silos in Legacy Systems
A knowledge silo happens when only one or two people understand how a system works. In many state offices, the entire data process lives inside the head of one employee. If that person gets a new job or retires, the office loses its ability to function.
Qlik Cloud solves this by being easy to use and well-documented. It uses a simple interface that a new employee can learn in a few days. This means the agency is no longer held hostage by old, complicated code that nobody understands.
Why Qlik Cloud is the Right Choice in 2026
Qlik has spent years perfecting its cloud platform for the public sector. It is not just a tool for making charts. It is a complete system for managing data from start to finish. For a government agency, this means they can connect all their different departments into one view.
One of the biggest benefits is the ability to see data in real time. In the past, a state agency might only see their budget health once a month. With Qlik, they can see it every hour. This helps leaders make better choices before a small problem becomes a big, expensive disaster.
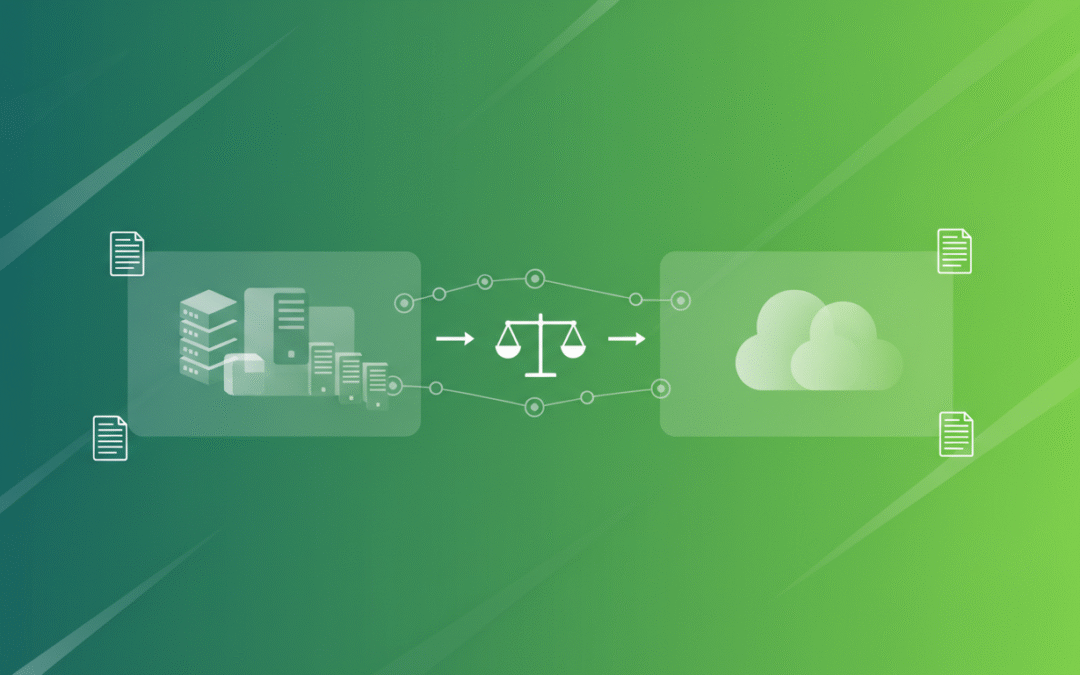
Simple Data Architecture
The way data moves in a modern system is much simpler than in the old days. Below is a basic look at how Qlik Cloud simplifies the journey of information.
Legacy Workflow (Complex and Slow): Old Database -> Manual Export -> Spreadsheet -> Email -> Manual Cleanup -> Old Reporting Tool -> Outdated Report
Qlik Cloud Workflow (Simple and Fast): All Data Sources -> Qlik Cloud Automated Integration -> Real-Time Dashboard -> Instant Insights for All Users
By removing the middle steps, the organization saves hundreds of hours of staff time every year. That time can be spent serving the public instead of fighting with spreadsheets.
Saving Money Through Efficiency
When a government moves to Qlik Cloud, the savings show up in several areas. First, the IT department no longer has to buy expensive servers every three years. Second, the software is always up to date, so there are no “surprise” upgrade fees.
Third, and most importantly, the agency becomes more efficient. If a department can find a way to save 5% on their energy bill or 10% on their supply chain because they have better data, that pays for the software many times over. This is why modernization is a smart financial move. It provides the “eyes” to see where money is being wasted across the whole organization.
Better Security for Less Effort
Security is a major concern for any government body. Keeping an old system secure requires constant manual work. You have to check for holes, apply patches, and monitor for intruders. Qlik Cloud handles all of this automatically. They have teams of experts whose only job is to keep the data safe. This gives local governments the same level of protection as a giant corporation without the giant price tag.
Taking the First Step Toward Modernization
Moving to the cloud does not have to happen all at once. Many successful organizations start with one department, like Finance or Public Works. Once they see how much time and money they save, they move the rest of the agency over.
The most important thing is to stop waiting. The risks of staying on legacy systems are growing every day. In 2026, the technology is ready, the security is proven, and the cost savings are clear.
If you want to learn more about how to start this journey, you can visit our services page to see how we help government groups transition to the cloud. You can also read about government data standards to see why modern architecture is now the requirement for public offices.
Conclusion: The Future is Modern
The goal of any state or local government is to serve the people well. It is hard to do that when you are held back by tools from the past. By choosing Qlik Cloud, agencies can lower their risks, support their people better, and save taxpayer money.
The transition away from legacy systems is not just a technical update. It is a way to make sure the government is ready for the challenges of the future. Don’t let outdated architecture drain your budget and slow down your mission. The move to a modern platform is the best investment a public leader can make in 2026.
There is a painful truth about Qlik Cloud scalability that most people do not want to talk about. If you have spent any time in the world of business intelligence, you have likely heard the whispers. People worry that moving to the cloud means losing control over performance. They fear that as their data grows and their user base expands, the system will eventually hit a wall that they cannot move.
The painful truth is not that Qlik Cloud cannot scale. The painful truth is that most teams scale the wrong things first. They scale their app count, their reload frequency, and their user permissions without a plan. Then, when things slow down, they blame the platform.
In reality, Qlik Cloud offers scalability strengths that often surpass what is possible in a traditional Qlik Sense on-premises environment. The secret is understanding how to use those strengths correctly. This post explores the reality of scaling in Qlik Cloud and how it compares to the old way of doing things.
If you are planning a major growth phase or a migration, we can help you sanity check your approach at Arc Qlik Consulting Services.
The Real Reason People Doubt Qlik Cloud Scalability
When a team says Qlik Cloud does not scale, they are usually reacting to symptoms of a deeper issue. Scalability doubt usually starts when one of these things happens:
Dashboards begin to feel sluggish as more users log in simultaneously.
Reload windows become crowded and lead to frequent failures.
The number of apps grows so fast that nobody knows which one is the source of truth.
Governance becomes a bottleneck that stops new projects from moving forward.
These are not platform failures. These are scaling symptoms. They are almost always caused by design choices rather than platform limits. The shift from Qlik Sense on premises to Qlik Cloud requires a shift in how you manage growth.
What Scalability Actually Means in Qlik
To scale effectively, you have to measure the right things. Scalability is not just one number. It is a combination of several different dimensions that all need to grow together.
User scalability – Add more people without breaking access or performance.
Data scalability – Handle more volume and history without creating bloated apps.
App scalability – Support more dashboards without duplication and chaos.
Reload scalability – Refresh data reliably as your frequency grows.
Governance scalability – Maintain standards without blocking your teams.
Scalability Dimensions and What to Measure
Dimension
What Grows
What Usually Breaks First
What to Monitor
Users
Adoption across roles
Permissions and content sprawl
Spaces, roles, and app ownership
Data
History and granularity
App size and reload time
App size and reload duration
Apps
Number of published apps
Duplicate logic and inconsistent KPIs
App inventory and reuse rates
Reloads
Frequency and scheduling
Reload queue conflicts
Reload windows and failure rates
Governance
Teams and domains
Slow approvals and bottlenecks
Space design and publishing flow
The Reframe: Why Qlik Cloud is Actually Stronger
The painful truth is that many teams bring their old Qlik Sense habits into Qlik Cloud. They lift and shift their apps without redesigning their operating model. When you treat a cloud platform like a folder of files on a local server, scalability will always look bad.
Qlik Cloud is designed to be a governed product platform. When you use it that way, it scales much more cleanly than an on-premises environment. You no longer have to worry about scaling servers, managing nodes, or performing manual upgrades. The platform handles the infrastructure so you can focus on the data.
Qlik Cloud vs Qlik Sense: Scalability Differences
The way you scale in Qlik Cloud is fundamentally different from Qlik Sense on premises.
Infrastructure Ownership In Qlik Sense, scaling often means adding more hardware. You have to manage nodes, load balancing, and maintenance effort. In Qlik Cloud, that infrastructure management shifts away from your team. You scale by adjusting your plan and your app design rather than your server rack.
Standardization and Governance Qlik Cloud encourages the use of spaces and shared content patterns. This makes it easier to maintain standards as you grow. Qlik Sense environments often evolve into a collection of isolated apps that are difficult to govern at scale.
Growth Path Expanding in Qlik Cloud is a matter of configuration. You add capacity and features as your needs grow. Expanding an on-premises environment often requires a full project involving hardware procurement and software upgrades.
Qlik Cloud vs Qlik Sense Scalability at a Glance
Topic
Qlik Cloud
Qlik Sense (On Prem)
Scaling Effort
Focus on configuration and design
Focus on infrastructure and design
Growth Friction
Governance and app sprawl
Hardware limits and upgrades
Operations
Tenant-level management patterns
Server and node management patterns
Slowdown Causes
App design and reload strategy
App design and hardware constraints
Common Scalability Mistakes and How to Fix Them
Most scalability issues come down to a few common mistakes.
Mistake 1: The Giant App Many teams try to put every possible metric into a single massive app. As the data grows, the app becomes slow, and the reloads become fragile. The Fix: Split your apps by domain and audience. Use a curated data layer so multiple apps can share the same foundation without duplicating the data.
Mistake 2: Logic Duplication When every app has its own version of a “Gross Margin” calculation, you cannot scale. Eventually, the numbers will stop matching. The Fix: Standardize your business logic. Use shared resources and master items so that a change in one place updates everywhere.
Mistake 3: Competing Reload Schedules If every app is set to reload at 8:00 AM, your reload queue will spike, and failures will follow. The Fix: Stagger your reloads. Align the frequency with the actual business need. Not every app needs to refresh every hour.
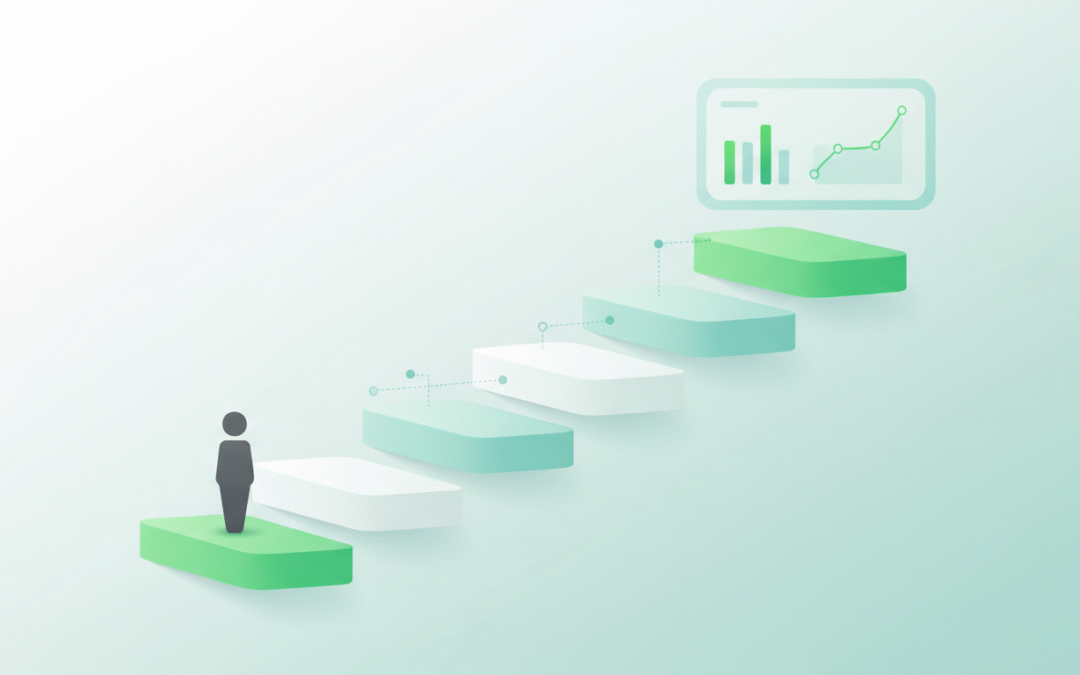
A Simple Scalability Roadmap
Scaling is a journey that happens in phases. You do not need enterprise-level governance on day one, but you do need a path to get there.
Phase 1: The Pilot Focus on proving value with a small set of apps. Establish naming standards and a basic space model early. This prevents chaos from taking root.
Phase 2: Departmental Rollout Define a clear publishing workflow. Create a repeatable process for how data is moved and how apps are promoted from development to production.
Phase 3: Enterprise Scale Formalize ownership by business domain. Introduce app portfolio management to ensure that you are not supporting hundreds of apps that nobody uses.
How to Tell if You Are Scaling the Right Way
You can tell your scalability strategy is working if you see these signals:
Your reload success rates stay stable even as you add more data.
Your app inventory stays organized and easy to navigate.
Business definitions remain consistent across different dashboards.
New teams can join the platform without requiring a custom setup.
Ownership is clearly defined for every app and dataset in the tenant.
Warning Signs vs. Healthy Signals
Area
Warning Sign
Healthy Signal
Apps
Hundreds of near-duplicate apps
Clear reuse of data and logic
Reloads
Frequent failures during peak times
Predictable and staggered schedules
Governance
Everything requires a custom exception
Standard patterns work for most teams
Performance
Users complain that it feels slower
Performance is measured and stable
Conclusion
The painful truth about Qlik Cloud scalability is that it requires discipline. The platform can handle massive amounts of data and thousands of users, but it cannot fix a bad design. When you move away from old on-premises habits and embrace a governed, capacity-based model, Qlik Cloud becomes an incredibly powerful engine for growth.If you want to ensure your Qlik environment is built to last, we can help you design a strategy that scales with your business. Explore our Qlik Consulting Services to learn more.
Try Qlik Cloud for Free
If you want to see how Qlik Cloud scales for yourself, you can start a free 30-day trial. It is the best way to explore the platform, load your own data, and test the features we discussed today without any upfront commitment.
If you are trying to decide between Qlik Sense and Qlik Cloud, licensing is one of the first places to start. It affects how you budget, how you grow, and how you explain costs to finance and leadership.
This post focuses only on licensing. It compares how Qlik Sense (on-prem) and Qlik Cloud Analytics think about users, capacity, and what is included in different plan tiers. Future posts in this series will cover architecture, features, integration, and mobile.
If you need help working through this in your own environment, you can always reach out to us at Arc Qlik Consulting Services.
What We Mean by Qlik Sense vs Qlik Cloud
Before diving into licensing, it helps to clarify the products.
Qlik Sense (On Prem) Qlik Sense in this article refers to the traditional on-premises deployment that you install and manage yourself, either on your own servers or in an infrastructure as a service environment.
Licensing here is traditionally based on:
User types, such as creators versus viewers
Server or site licenses and infrastructure capacity
You mainly think about how many people will create content, how many will consume it, and what hardware you need to run it.
Qlik Cloud Analytics Qlik Cloud Analytics is the software-as-a-service (SaaS) platform that Qlik offers. You do not manage the underlying infrastructure. You subscribe to a plan.
Licensing in Qlik Cloud is based on:
Plan tiers such as Starter, Standard, Premium, and Enterprise
Capacity for data that you analyze, measured in gigabytes
Included features such as reporting, automations, predictive capabilities, app sizes, and access options
You mainly think about how much data you will analyze and what level of capability you need.
User-Based vs Capacity-Based Licensing
At a high level, Qlik Sense and Qlik Cloud use different lenses for licensing.
Qlik Sense (On Prem)
Primary Focus
Users and infrastructure
You typically size around:
Number of professional creators
Number of analyzers or consumers
Number of sites and servers
Monitoring and control
Licensing is enforced through user assignment, access rules, and server capacity
Capacity for data that is loaded and stored for analysis
Plan tier that controls features and limits
You typically size around:
Total volume of data for analysis across your tenant in a year
Which plan level matches your feature needs and growth
Monitoring and control
Admins watch capacity use for data for analysis
Qlik provides alerts as you approach your plan capacity
You can upgrade capacity or move to a higher plan when needed
A simple way to think about it:
Platform
Main Licensing Focus
What You Size Around
Qlik Sense (On Prem)
Users and infrastructure
Creators, viewers, servers
Qlik Cloud Analytics
Capacity and plan tier
Data for analysis, features, scale
Qlik Cloud Plan Tiers and What They Include
The Qlik Cloud Analytics plans are structured into tiers. Below is a summary of what is included in each, based on the current pricing page. This is a functional overview, not a copy of the site content, and not a list of prices.
Qlik Cloud Starter
Designed for small businesses and very small teams.
Key characteristics:
Fixed number of users included
Fixed amount of data for analysis included
No option to purchase extra data capacity beyond what is included
Included capabilities:
Analytics with interactive visualizations and dashboards
AI-powered insight features that come with Qlik Cloud Analytics plans
Standard connectors to hundreds of data sources
Ability to move data into Qlik Cloud for relational and software as a service sources through Qlik Talend Cloud
Sharing and collaboration within the team
Max app size limit on the smaller side, such as 5 GB per app
Community level support
Starter is a good fit for small companies that want to try Qlik Cloud in a contained way.
Qlik Cloud Standard
Designed for small teams and groups that need more flexibility than Starter.
Key characteristics:
Includes user access across the tenant
Starts with a base amount of data for analysis
You can purchase additional capacity in defined increments, such as 25 GB blocks
Included capabilities, in addition to Starter:
Use of unstructured data to drive insight
Report generation and delivery
No code automation builder that can trigger actions across connected systems
Managed and shared spaces that improve governance and collaboration
Personal space for each user, such as 1 GB per user
Augmented analytics that helps users explore data more effectively
24×7 critical support
Standard is typically where many departmental and mid-sized deployments start.
Qlik Cloud Premium
Designed for broader rollout across a business with more advanced requirements.
Key characteristics:
Starts with more data for analysis than Standard
Allows additional capacity to be purchased in larger increments, such as both 25 GB and 250 GB blocks
Included capabilities, in addition to everything in Standard:
Predictive analytics powered by automated machine learning tools
More capacity for generative style capabilities
Anonymous or public access for dashboards and content
Deeper data integration options:
Additional Qlik Talend Cloud data sources including SAP, mainframe, and legacy systems
Seamless extraction from SAP into Qlik Cloud
Data lineage connectors for better visibility into data flows
Higher max app size, such as 10 GB per app
Guided customer success onboarding
Premium is usually a match for organizations that want Qlik Cloud to be a central analytics platform, not just a small team tool.
Qlik Cloud Enterprise
Designed for large enterprises that need maximum scale and flexibility.
Key characteristics:
Starts at a much higher data for analysis capacity
Tailored for large deployments and broader enterprise standards
Included capabilities, in addition to everything in Premium:
More capacity bundled into:
Reporting
Automations
Public or anonymous access
Assistants and predictive models
Dataset sizes and number of models
Larger default app sizes, such as 15 GB, with options to support very large apps, up to tens of gigabytes per app with additional purchases
More personal space per user, such as 3 GB
Multi-region tenants for global deployments
Personalized customer success plans and onboarding
Enterprise is targeted at organizations that want to standardize on Qlik Cloud at scale.
A simple summary table:
Plan
Sized Around
Ideal For
Highlights
Starter
Fixed users and fixed data capacity
Small business, pilots
Core analytics, dashboards, smaller apps, community
Standard
Data capacity expandable in steps
Teams and departments
User access for all, automations, reporting, spaces
Premium
Larger capacity and advanced features
Mid to large organizations
Predictive, more GenAI capacity, public access, SAP
Enterprise
Large capacity and scaled features
Large enterprises
Very large apps, more automations, multi-region, CSP
How Qlik Cloud Measures and Monitors Usage
Qlik Cloud uses a capacity-based model, which Qlik compares to a cell phone plan in the pricing FAQ.
Capacity-based means you pay a fixed fee for a set amount of capacity.
This gives more predictable costs than true consumption models, where monthly bills can swing up and down.
Data for analysis as the main metric
You estimate how much data you will load and store for analysis over a year.
That total is what the plan is sized around.
What happens when you approach capacity
You keep full access to your environment.
You receive alerts as you get close to your limit.
You can choose to:
Upgrade to a higher capacity
Upgrade to a higher plan
Additional charges only appear if you go above the limits of your plan without adjusting it.
How admins monitor usage
Admins can view current capacity use
They can see which apps or datasets are driving usage
They can use this information to plan clean-up, archiving, or upgrades
You can picture it as a progress bar labeled Data For Analysis that moves from comfortable, to approaching the limit, to an upgrade suggested.
Comparing Licensing in Practice
Most teams want to know how this affects real decisions.
How You Think About Sizing
Qlik Sense (On Prem)
You tend to ask:
How many people will build apps, dashboards, and data models
How many people will consume those apps
How many environments and servers you need to support development, test, and production
User types and server footprint drive licensing and infrastructure costs.
Qlik Cloud Analytics
You tend to ask:
How much data will we analyze across all apps over a year
How fast that data volume is likely to grow
Which plan level we need for:
Reporting and scheduled outputs
Automations and triggers
Public access or external users
Predictive capabilities
SAP and advanced lineage
A practical comparison:
Question
Qlik Sense (On Prem)
Qlik Cloud Analytics
How many creators vs viewers do we have
Main sizing driver
Still important but not the main metric
How large are our datasets
Drives hardware requirements
Drives plan and data for analysis capacity
Do we need external or public dashboards
Requires custom patterns or add ons
Included with Premium and Enterprise plans
How large are our apps
Handled through server tuning
Controlled by app size limits by plan tier
Governance and Tenants
Plan tiers in Qlik Cloud also influence:
How many collaboration and managed spaces you use
How much personal space each user has
Whether you can run tenants across multiple regions
The level of onboarding and customer success support that comes bundled
These governance aspects become more important as analytics shifts from a single team to a company-wide platform.
If you are planning a hybrid setup or a staged migration from Qlik Sense to Qlik Cloud, it can be useful to map both licensing models side by side. This is where a short working session with a partner can help. You can learn more about our services at:
There is no single right answer. Both Qlik Sense and Qlik Cloud can make sense, depending on context.
Situations where Qlik Cloud licensing is often attractive:
You want predictable yearly costs based on capacity, not variable month-to-month bills
Your number of viewers is growing quickly and you want to simplify user-based calculations
You plan to take advantage of:
Built in reporting and automated distribution
Automations that trigger actions in other systems
Predictive capabilities that are available in higher tiers
Public or external sharing of dashboards
Situations where Qlik Sense on premises may still be important:
Strong regulatory or residency requirements tied to existing data centers
A heavily tuned on-premises environment that will be part of a long-term migration path
Existing investments in infrastructure that you plan to use for several more years
A common pattern is to run both during a transition period and to move workloads gradually.
How To Start Comparing Licensing For Your Organization
If you are trying to make this decision for your own team, a simple checklist helps.
Inventory your users
How many true creators do you have
How many consumers
Which groups will need access in the next 12 to 24 months
Estimate your data for analysis
Total size of your current analytics datasets
Expected growth over the next few years
How often full reloads or history loads occur
List feature needs
Reporting and scheduled distribution
Automations and workflows
Public or customer-facing dashboards
SAP and complex source systems
Regulatory or residency requirements
Map to models
How this fits with your current Qlik Sense licensing
Which Qlik Cloud plan tier feels like a realistic starting point
You can use the “Compare all plan features” section on the Qlik pricing page to fill in detailed questions for internal review.
If you want a second set of eyes, our team at Arc can help you run concrete scenarios. You can connect with us at Contact Arc.
What Comes Next In The Series
This article focused only on licensing. In the rest of this Qlik Sense vs Qlik Cloud series, we will cover:
Architecture and deployment differences
Feature and capability comparisons
Integration and data movement
Mobile and embedded analytics
If you want to follow along, you can keep an eye on the Qlik category on our blog.
In the meantime, if you are in the middle of a licensing decision or a Qlik Cloud migration and want a simple way to talk it through, we are happy to help.
If you are new to Qlik, it can be hard to know what to do first. You may have access to a Qlik Cloud tenant, or you might be thinking about starting a trial, but you are not sure how to turn that into real progress.
This short beginner roadmap gives you a simple plan for your first week with Qlik. You do not need to learn every feature. You just need a clear place to start, a safe environment to click around in, and a few basic wins to build confidence.
If you want to follow along with a video version, you can pair this guide with our Qlik Beginner Roadmap video as you go.
Before you can learn Qlik, you need a place to practice. This can be a trial, a company tenant, or a sandbox provided by a partner. The key is to have somewhere you can safely build and test without worrying about breaking production reports.
Here are common options:
Option
What It Is
Best For
Qlik Cloud free trial
A 30-day trial of Qlik Cloud Analytics
Individuals and small teams who want to try Qlik
Company Qlik Cloud tenant
Your organization’s existing Qlik Cloud environment
Employees joining an existing analytics program
Partner sandbox
A Qlik environment set up and managed by a consulting partner
Teams that want structure, guardrails, and guidance
If your team needs help choosing between Qlik Cloud options or setting up tenants and spaces, you can explore our Qlik Consulting Services and Qlik Support.
Step 2: Join the Right Learning Resources
Learning Qlik is easier when you are not doing it alone. Good resources give you examples, answers, and a place to ask questions when you get stuck.
These resources will be your support system as you move beyond your first week and into more advanced topics.
Step 3: Get Comfortable With the Qlik Cloud Interface
Once you have access to Qlik Cloud, spend 30 to 60 minutes just exploring the interface. You do not need to build anything complex on day one. The goal is to feel comfortable clicking around.
Here are a few things to look for:
Where you see spaces or streams that hold content.
Where apps are listed and how to open them.
Where to add or upload data, such as an Excel file.
Where sheets and visualizations live inside an app.
Think of this like walking around a new office building. You are not trying to memorize every room. You just want to know where the main areas are and how to get back to the front door.
Your next goal is to get real data into Qlik, even if it is small and simple. An Excel file is a great place to start because it is familiar and easy to control.
You can use a basic file with columns like:
Date
Product
Region
Sales Amount
At a high level, your steps will look like this:
Open Qlik Cloud and go to the space where you are allowed to build.
Create a new app or open an empty starter app.
Choose the option to add data or upload a file.
Select your Excel file and let Qlik read the fields.
Confirm that Qlik shows a simple preview of the table with your columns.
You are not building a full data model or complex transformations here. You are just taking the first step of seeing your own data inside Qlik.
As you get more comfortable, it helps to understand the main pieces inside Qlik Cloud. You do not need every detail, but a simple mental model will make things easier when you work with your team or talk with admins.
Here are four core concepts in plain language:
Concept
Simple Description
Beginner Tip
Spaces / Streams
Areas that hold apps and content for groups of users
Ask which space is safe for your testing and practice
Apps
Containers that hold data, sheets, and visualizations
Start with one app for your first Excel file and charts
Data Connections
Saved links to data sources such as files, databases, or APIs
Begin with a single file before adding more sources
Users and Security
Rules that control who can see and change content
Confirm your role and permissions with your admin
In many organizations, these pieces are part of a broader data strategy that includes integration, governance, and reporting. If you want to see how Qlik fits into that bigger picture, you can explore our Data Strategy Consulting services or industry pages for Healthcare, Government, and Education.
Beginner Checklist: Your First Week With Qlik Cloud
To keep things simple, here is a quick checklist you can use to track your first week. You do not need to do everything in one day. Spread it out and give yourself time to explore.
In your first week:
Join Arc Academy for Qlik on Skool.
Follow Qlik and Arc Analytics on LinkedIn.
Get access to a Qlik environment:
Qlik Cloud trial
Company tenant
Partner sandbox
Log in and explore the Qlik Cloud interface for 30 to 60 minutes.
Load one Excel file as sample data into a new or existing app.
Build one simple bar chart using that data.
Learn where your spaces, apps, data connections, and user settings are managed.
If you can check all these boxes, you are officially started with Qlik. You may not feel like an expert yet, but you have done the most important part: moving from “someday” to hands-on practice.
What Comes Next in Qlik Cloud
After your first week, you can start to:
Add more data sources beyond Excel.
Build multiple sheets and more complex visualizations.
Learn about data modeling and transformations.
Work with IT or a partner on governance, security, and performance.
Your first week with Qlik does not need to be perfect. It just needs to move you closer to clear, useful insight from your data. In our next guide and video, we will walk through the most common mistakes beginners make with Qlik and how you can avoid them.
If you have heard the name Qlik but are not sure what it does or whether it fits your needs, this guide will help. Qlik is a business intelligence tool that helps people see and understand their data. It is used by companies in many industries to make better decisions faster.
This post will explain what Qlik is, what it does, and who uses it. By the end, you will have a clearer picture of whether Qlik might be a good fit for your team.
Qlik is a software platform that turns raw data into visual dashboards and reports. Instead of looking at rows and columns in a spreadsheet, you can see charts, graphs, and maps that show patterns and trends.
The main goal of Qlik is to help people answer questions about their business. Questions like:
Which products are selling the most?
Where are we losing customers?
How long does it take to complete a process?
What is our revenue this quarter compared to last year?
Qlik pulls data from different sources, such as databases, spreadsheets, and cloud apps. It then organizes that data so you can explore it, filter it, and share it with others. You do not need to be a data scientist to use Qlik. If you know what questions you want to answer, Qlik can help you find the answers.
Qlik does three main things: it connects to your data, it helps you explore that data, and it lets you share what you find.
1. Connect to Your Data
Qlik can pull data from many places. This includes databases like SQL Server, cloud tools like Salesforce, spreadsheets like Excel, and even web APIs. Once connected, Qlik brings all that data into one place so you can see the full picture.
2. Explore and Analyze
Qlik uses something called associative analytics. This means you can click on any part of a chart or table, and Qlik will show you how that selection relates to everything else. For example, if you click on a region, you can instantly see sales, customers, and products for that region. You do not have to build a new report every time you have a new question.
3. Share Insights
Once you build a dashboard or report, you can share it with your team. People can view it on their computer, tablet, or phone. They can also interact with it, filtering and exploring on their own. This makes it easier for everyone to stay on the same page.
Qlik is used by people in many different roles and industries. Here are some of the most common groups:
Business Leaders and Executives
Leaders use Qlik to see high-level metrics in one place. They can track revenue, costs, customer satisfaction, and other key numbers without waiting for a monthly report. Qlik helps them make faster, more informed decisions.
Managers and Department Heads
Managers use Qlik to monitor team performance, spot problems, and plan ahead. For example, a sales manager might use Qlik to see which reps are hitting their targets and which products are lagging. An operations manager might use it to track delivery times or inventory levels.
Analysts and Data Teams
Analysts use Qlik to dig deeper into data and find insights. They build dashboards, run reports, and answer questions from other teams. Qlik gives them a flexible tool to explore data without writing complex code.
Frontline Staff
Frontline workers use Qlik to see simple, focused views that guide their daily work. For example, a nurse might use a Qlik dashboard to see patient wait times, or a warehouse worker might use it to see order status.
Which Industries Use Qlik?
Qlik is used across many industries. Here are a few examples:
There are many business intelligence tools available. Here are a few reasons why companies choose Qlik:
Associative analytics: Qlik lets you explore data freely without being locked into a fixed path.
Fast performance: Qlik can handle large amounts of data and still respond quickly.
Cloud and on-premise options: You can run Qlik in the cloud or on your own servers.
Strong community: Qlik has a large user community, lots of training resources, and many partners who can help.
If you are comparing Qlik to other tools, it helps to think about your specific needs. What questions do you want to answer? Who will use the tool? How much data do you have? These questions will guide your choice.
Join a community: Connect with other Qlik users to ask questions and learn from their experience. Arc Academy for Qlik on Skool
Get support: If you need help with setup, training, or building dashboards, reach out to a Qlik partner. Arc Qlik Consulting Services
Start small: Pick one or two questions you want to answer. Build a simple dashboard. Learn as you go.
You do not need to master everything on day one. The most important thing is to start exploring and see how Qlik can help your team make better decisions.For more guidance, you can also check out our post on How To Get Started With Qlik in 2026.
If you are new to Qlik, it can be hard to know where to begin. There are many tools and many features, but you do not need to learn them all on day one. This short guide will give you a few simple things to think about as you get started.
You can follow along with the video series on our YouTube channel. As you go, you can also try Qlik for yourself and learn with others:
Qlik is a tool that helps you turn data into clear pictures and simple stories. Instead of digging through long spreadsheets, you can look at charts and dashboards that show what is going on in your business.
You do not have to be a data expert to use Qlik. The most important thing is to know what you care about. For example, you might want to see which products are selling best, how long customers wait, or where your team is falling behind. Qlik helps you see these answers in one place so you can make better choices.
You may hear two names: Qlik Sense and Qlik Cloud. Here is the simple way to think about them.
Qlik Sense is the name many people know from the last few years. It has been used to build dashboards and apps in many companies. Qlik Cloud is the newer, cloud-based home for Qlik. It runs in the cloud, so your team does not have to manage as much hardware or do as many updates.
If you are just starting now, Qlik Cloud is usually the best place to begin. It is easier to reach from anywhere, it gets new features faster, and it is what we focus on in our guides and videos. If you already use Qlik Sense or are not sure which one fits your plans, we can help you think it through at Arc Qlik Consulting Services or Arc Qlik Support.
What Is Qlik In 2026?
Qlik is changing. When you start now, you are not just learning today’s tool. You are getting ready for where Qlik is going.
By 2026, more work with Qlik will happen in the cloud. It will be easier to see numbers close to real time instead of waiting for a monthly report. Qlik will also be more connected to other tools you already use, so data can flow more smoothly across your systems.
Most of all, Qlik will be more than just “nice dashboards.” It will help you see what happened, what is happening right now, and what might happen next. When you plan your Qlik journey, try to think about the next few years, not just the next few weeks. If you want a partner to plan that path, you can explore Qlik Talend Data Fabric and Cloud Services.
Who Uses Qlik?
People in many roles and industries use Qlik every day. Business leaders use it to see key numbers in one place. Managers use it to track performance and spot problems. Analysts use it to dig deeper into data and share insights. Frontline staff use it to see simple views that guide their daily work.
Qlik is also common in healthcare, government, and education. You can see some of those use cases here:
As you get started, it helps to ask a few questions. Who needs to see the numbers? Who will own the main questions you want to answer? Who can help build and support Qlik over time? You do not need perfect answers, but even a simple picture of “who” will guide better choices
Getting Access
To get started, you need two things: a place to work and people to help you.
A free 30-day Qlik Cloud Analytics trial gives you a safe place to explore. You can log in, click around, and see if the tool fits your style without a big commitment. You can start that here: Free 30-day trial for Qlik Cloud Analytics
Support matters too. Joining Arc Academy for Qlik lets you learn with others, ask questions, and get guidance: Arc Academy for Qlik on Skool
You can also reach out to our team for help with training and setup through Training and Contact Us.
As you begin, write down one or two questions you want Qlik to answer. Start your trial, join the community, and follow along with the first video. Your first steps do not have to be perfect. They just need to move you closer to clear, useful insight from your data.
Organizations today are overwhelmed with data. They invest heavily in sophisticated analytics tools, build intricate data pipelines, and craft beautiful dashboards. Yet, despite all this effort, a common and frustrating problem persists: non-technical users often feel lost without training. They struggle to understand what the numbers mean, which reports to trust, or how to apply insights to their daily work.
This is more than a minor inconvenience. When users are confused, they either avoid data altogether or constantly ping the data team with questions. This turns valuable data professionals into a support desk, diverting them from strategic initiatives. The real challenge is not only about building better dashboards; it is about building better data literacy and confidence among the people who need to use that data every day.
One practical way to solve this is by pairing your data stack with a dedicated community platform. That is exactly why we created our Skool community, Arc Academy for Qlik. It is a space where Qlik users and data teams can learn together, share best practices, and turn confusion into clarity.
The Real Data Challenge Is Not Dashboards, It’s Training People
Many organizations believe that if they just build enough dashboards, users will magically become data-driven. The reality is far more human. Non-technical users face a specific set of anxieties:
“I don’t know which report to trust; they all show slightly different numbers.”
“I’m afraid I’ll pull the wrong number and make a bad decision.”
“What does this metric actually mean, and how is it calculated?”
“Where do I even start when I need to find information?”
These anxieties lead to real business impacts. Decisions slow down as people second-guess data or revert to gut feelings. Valuable insights remain locked away in underused reports. The data team is constantly interrupted with repetitive requests, which limits their ability to drive strategic value.
Services like data analytics and data engineering can perfect your data pipelines. But if the people who rely on that data do not feel confident using it, the investment will never fully pay off. That is where a community like Arc Academy for Qlik becomes a force multiplier. It connects people with similar questions and challenges so no one has to figure it out alone.
Why Traditional Training Fails Non-Technical Users
The typical approach to data education often falls short. One-time training sessions, while well-intentioned, rarely stick. Information overload means most details are forgotten within days. Static documentation, whether in PDFs or internal wikis, quickly becomes outdated and is rarely consulted. New hires face a steep learning curve with no easy, centralized way to understand your unique metrics and reports.
This cycle leads to the same questions being asked repeatedly across different channels, creating inefficiency and frustration for both data providers and data consumers.
Here is a simple comparison of the old way versus a community-first approach:
Area
Traditional Training
Community-First Approach (Arc Academy for Qlik)
Content Access
One-off sessions, PDFs
Always-on video, posts, and Q&A
New Hire Onboard
Ad hoc explanations
Guided learning paths and pinned lessons
Questions
Private DMs and email
Public threads others can learn from
Updates
Hard to keep docs in sync
New posts, comments, and notifications
In Arc Academy for Qlik, questions and answers are shared openly. That means every answer helps dozens or hundreds of people, not just one.
Using Community to Teach Data in Plain Language
A Skool community like Arc Academy for Qlik acts as a dynamic, always-on classroom and support hub for Qlik users and data consumers. It is a place where complex data concepts are broken down into straightforward, plain language explanations.
Inside a community like this, you can expect:
Short posts explaining key metrics and Qlik concepts in simple terms.
Screen recordings that walk through real dashboards step-by-step.
Examples of how different teams use Qlik to solve everyday problems.
The focus is on clarity, not jargon. For organizations working in sectors like government, healthcare, or education, this means explaining metrics that directly relate to your world. For instance, reporting tied to government data analytics services, healthcare analytics, or education analytics can be broken down with relatable examples.
When these explanations live in a community instead of a static document, they can be updated, discussed, and improved over time.
Turning One-Off Questions Into Reusable Learning
One of the biggest wins of a community platform is how it converts individual questions into shared knowledge.
In Arc Academy for Qlik, for example:
Someone posts a question about a Qlik app, metric, or best practice.
An expert or another community member shares an answer, often with screenshots or a brief video.
That thread is now searchable and available to everyone, not just the original poster.
Over time, the most helpful threads can be turned into curated resources, pinned posts, or structured mini-courses. Instead of your data team answering the same question over and over in private channels, the community builds a living knowledge base that keeps getting better.
This “strength in numbers” effect is powerful: each person’s question improves the experience for the whole group.
Designing Spaces Around Real Roles and Use Cases
To make a community useful, it should mirror the way people actually work. Organizing content by tool alone is not enough. It is far more effective to organize by role, workflow, or business problem.
In Arc Academy for Qlik, that might look like:
Spaces focused on leaders and how they should read executive dashboards.
Areas where finance or operations teams can dive into KPIs that matter most to them.
Threads highlighting specific use cases from the public sector, healthcare, or education.
This role-based structure matches how Arc Analytics builds solutions in client environments. Whether you are consolidating data sources or deploying Qlik at scale, your users need to see themselves and their challenges reflected in the way learning is organized.
Measuring the Impact of a Data Community Training
A community should not just feel good; it should deliver results. You can measure the impact of a Skool community like Arc Academy for Qlik by tracking:
Fewer repetitive questions to the data or BI team.
More active users in Qlik and other analytics tools.
Shorter onboarding time for new hires who need to work with data.
Better alignment on “one version of the truth” for core KPIs.
You can also look at community analytics such as active members, post engagement, and course completion rates. Combined with product usage data, this paints a clear picture of how community participation supports data adoption and better decisions.
How to Get Started Without Overwhelming Your Team
The good news is that you do not have to build your own community from scratch. You can plug into an existing one.
A simple way to start is to join Arc Academy for Qlik:
Explore real questions other Qlik users are asking.
Learn from shared examples, templates, and best practices.
Bring your own questions and challenges and get feedback from both peers and experts.
By joining an established community, your team benefits from a broader network. You are not just learning from your own use cases; you are learning from dozens of organizations that are solving similar problems in different ways. That is the power of strength in numbers.
Moving Forward: Build Confidence Through Training, Not Just Dashboards
Your data challenges are not just technical; they are human. Tools like Qlik are incredibly powerful, but without confidence and understanding, they will never reach their full potential.
A community like Arc Academy for Qlik gives users a safe, structured, and collaborative environment to learn, ask questions, and grow. It turns your data journey into something shared, not something every team has to figure out on its own.
At Arc Analytics, we help clients build strong data foundations and the human systems that sit on top of them. If you want your investment in Qlik and analytics to translate into real-world adoption, joining a community is one of the fastest ways to accelerate that progress. Join Arc Academy for Qlik today and see how much easier data becomes when you are not learning it alone.
Government shutdowns create immediate operational challenges that ripple through every department. When staff are furloughed and budgets freeze, the work doesn’t stop. HR still needs to process payroll. Finance teams must track spending. Logistics departments have to manage contracts and inventory. The question isn’t whether these functions matter during a shutdown. The question is how agencies can maintain them with fewer people and limited resources. The answer lies in data automation platforms that reduce manual work, maintain data quality, and speed up recovery when normal operations resume.
The Real Cost of Manual Data Processes
Most government agencies still rely heavily on manual data entry, spreadsheet management, and person-dependent workflows. These systems work fine when everyone is at their desk. During a shutdown, they fall apart quickly.
Consider what happens in a typical HR department. Employee records need updating. Benefits require processing. Time and attendance data must be collected and verified. When half the team is furloughed, these tasks pile up. The backlog grows every day. When staff return, they face weeks of catch-up work before operations normalize.
Finance departments experience similar problems. Budget tracking stops. Invoice processing slows. Financial reports go stale. According to J.P. Morgan research, the longer a shutdown lasts, the harder it becomes to restart financial operations and reconcile accounts.
Logistics teams struggle to maintain visibility into supply chains, contracts, and procurement. Manual tracking systems can’t keep up when the people managing them aren’t working. Critical information gets lost. Vendors wait for answers. Projects stall.
The Value of Automation During Crisis
Automated data platforms solve these problems by removing the dependency on constant human intervention. These systems continue collecting, validating, and organizing data even when offices are understaffed.
Think about payroll processing. An automated system pulls time and attendance data, calculates pay, processes deductions, and generates reports without manual input. When HR staff are furloughed, the system keeps running. Employees still get paid on time. Benefits continue without interruption. When the shutdown ends, there’s no backlog to clear.
The same principle applies to financial operations. Automated data integration connects accounting systems, procurement platforms, and budget tracking tools. Transactions flow automatically. Reports update in real time. Finance teams can monitor spending and maintain compliance with skeleton crews.
For logistics, automation provides continuous visibility. Contract management systems track deadlines and deliverables. Inventory systems monitor stock levels. Procurement platforms maintain vendor relationships. These functions don’t pause when people do.
Three Pillars of Resilient Data Infrastructure
Building resilience requires more than just automation. Government agencies need data platforms built on three core principles.
Curation ensures data quality remains high regardless of staffing levels. Automated validation rules catch errors before they spread through systems. Standardized data formats make information easy to find and use. When operations resume after a shutdown, teams work with clean, reliable data instead of spending weeks fixing problems.
Governance maintains security and compliance during disruptions. Access controls protect sensitive information. Audit trails track every change. Approval workflows continue functioning even with reduced staff. These safeguards prevent the chaos that often follows a shutdown when agencies discover compliance gaps or security issues.
Integration connects systems across departments and functions. HR platforms talk to finance systems. Procurement tools share data with logistics. Budget tracking connects to spending analysis. This connectivity means information flows automatically instead of requiring people to manually transfer data between systems.
Measuring Recovery Time
The difference between manual and automated systems becomes obvious when measuring recovery time. Agencies using manual processes typically need three to four weeks to return to normal operations after a shutdown. They spend this time reconciling accounts, clearing backlogs, and fixing errors that accumulated during the disruption.
Agencies with automated data platforms recover in days instead of weeks. Their systems maintained data quality during the shutdown. Backlogs are minimal. Staff can focus on strategic work instead of administrative catch-up.
Function
Manual Process Recovery
Automated Platform Recovery
HR & Payroll
3-4 weeks
2-3 days
Financial Reporting
4-6 weeks
1 week
Contract Management
2-3 weeks
3-5 days
Budget Reconciliation
4-5 weeks
1-2 weeks
These time savings translate directly to cost savings. Less time spent on recovery means more time delivering services. Fewer errors mean less rework. Better data quality supports better decisions.
Building for the Next Disruption
Government shutdowns aren’t the only disruptions agencies face. Natural disasters, cybersecurity incidents, and public health emergencies create similar challenges. Automated data platforms provide resilience against all these scenarios.
The investment in data engineering and automation pays dividends every day, not just during crises. Staff spend less time on repetitive tasks. Leaders get better information faster. Agencies can redirect resources toward mission-critical work.
Starting this transformation doesn’t require replacing every system at once. Most agencies begin by automating their most manual processes. HR and finance functions offer quick wins because they involve repetitive tasks with clear rules. Success in these areas builds momentum for broader changes.
Working with experienced data analytics consultants helps agencies identify the right starting points and avoid common pitfalls. The goal isn’t technology for its own sake. The goal is building systems that keep working when everything else stops.
Moving Forward with Automation
The next shutdown will happen. The timing is uncertain, but the impact is predictable. Agencies that prepare now will maintain operations while others struggle. The difference comes down to infrastructure. Manual processes fail under pressure. Automated systems keep running.
Government leaders who invest in modern data platforms aren’t just preparing for shutdowns. They’re building the foundation for better service delivery, smarter resource allocation, and more effective operations every single day.
Whether you’re looking to automate HR processes, streamline financial reporting, or improve logistics visibility, our team can help you identify quick wins and build a roadmap for long-term resilience.
Schedule a consultation with our government data experts to discuss your specific challenges and discover how automated data platforms can transform your agency’s operations.
In 2025, the gap between data-driven organizations’ perception of AI Readiness and everyone else is widening fast. Budgets are tighter, expectations are higher, and leadership wants measurable outcomes instead of more tools. For teams working in Healthcare, Higher Education, and State & Local Government, the challenge is even more complex. You’re managing sensitive data across disconnected systems, meeting strict compliance requirements, and trying to deliver better outcomes with fewer resources.
This AI Readiness guide helps you assess where your data stack stands today. You’ll identify which maturity bucket you fall into: Lots of Work to Do, A Little Behind, or Right on Track—and understand the specific pain points holding you back from making data a strategic asset instead of an operational burden.
Quick Checklist for AI Readiness
Before we dive in, take a moment to score yourself on these nine capabilities. Answer yes or no to each:
Do you have a single source of truth that consolidates data from your core systems like your EHR, SIS, ERP, CRM, and financial platforms?
Are your data pipelines monitored with clear SLAs so you know when something breaks before your users do?
Have you documented your key metrics and definitions in a way that everyone across departments can reference?
Do you have data quality tests and lineage tracking so you understand where your numbers come from and can trust them?
Are role-based access controls, PII tagging, and audit trails in place to meet compliance requirements?
Can you activate data back into operational tools to drive real-time decisions?
Do you have self-serve BI with governance policies and a process to deprecate unused dashboards?
Is cost observability built in so you can track usage, cost per query, and unit economics?
Do you have secure zones and frameworks ready for advanced analytics and AI use cases?
Scoring: 0–3 Yes: Lots of Work to Do 4–6 Yes: A Little Behind 7–9 Yes: Right on Track
Understanding the Maturity Buckets of AI Readiness
Lots of Work to Do
If you’re in this bucket, you’re likely dealing with data chaos on a daily basis. Your EHR, SIS, ERP, CRM, and financial systems are siloed islands. Data moves between them through manual CSV exports, email attachments, or one-off integrations that break without warning. When leadership asks for a report, it takes days or weeks to pull together, and even then, different departments come back with conflicting numbers because no one agrees on basic definitions.
You don’t have a clear data owner, and there’s no central place where people can go to find trusted metrics. Compliance is a constant worry because you’re not sure who has access to what, and audit trails are either nonexistent or buried in system logs no one ever checks. Your team spends more time firefighting data issues than actually analyzing anything, and trust in your numbers is low across the organization.
The risks here are significant. Poor data leads to poor decisions. Compliance exposure grows every day, according to HIPAA, FERPA, and state data protection standards. You’re likely overspending on tools that don’t talk to each other, and your team is demoralized because they’re stuck doing manual work instead of strategic analysis. If you’re in healthcare, this might mean delayed insights into denied claims or readmissions. In higher ed, it could be conflicting enrollment numbers that make it impossible to forecast revenue. For state and local government, it often shows up as slow responses to constituent requests and no visibility into program performance.
A Little Behind
If you’re in this bucket, you’ve made progress but you’re hitting new bottlenecks. You have a data warehouse or lakehouse that consolidates some of your core systems, but it’s not complete. Your EHR or SIS data might be there, but your CRM, financial aid, grants management, or constituent service platforms are still disconnected. Dashboards exist, but they’re slow, and users complain about stale data or unclear definitions.
You have some governance in place, but it’s ad-hoc. Access controls exist, but they’re not consistently enforced. PII and PHI tagging happens sometimes, but not systematically. When a pipeline breaks, you find out from an angry user instead of a monitoring alert. You’re starting to see your data costs climb, but you don’t have visibility into what’s driving them or which queries and dashboards are the culprits.
The risk here is that you’re stuck in the middle. You’ve invested in data integration and data engineering infrastructure, but adoption is plateauing because users don’t trust the data or find it too slow. Your pipelines are brittle and break when source systems change schemas. Costs are rising faster than value, and you’re not sure where to focus next. In healthcare, this might mean you have quality metrics dashboards, but care teams don’t use them because the data is two days old. In higher ed, you might have enrollment dashboards, but admissions and financial aid are still using different definitions of “yield.” For government, you might have 311 data in a warehouse, but no way to route high-priority tickets automatically.
Right on Track
If you’re in this bucket, your data stack is a strategic asset. You have a consolidated warehouse or lakehouse that brings together your EHR, claims, scheduling, and patient experience data in healthcare. In higher ed, your SIS, LMS, CRM, financial aid, and alumni systems feed a single source of truth. For government, your finance, constituent services, public safety, and program data are unified with clear lineage and ownership.
Your metrics are documented in a semantic layer that everyone references. When someone asks about readmission rates, enrollment yield, or service ticket resolution time, there’s one definition and one dashboard everyone trusts. Data quality tests run automatically, and lineage tracking means you can trace every number back to its source. Role-based access controls are enforced consistently, and sensitive data is tagged and governed with full audit trails that meet ONC Interoperability standards, IPEDS reporting requirements, and open data transparency mandates.
But what really sets you apart is activation and AI readiness. You’re not just reporting on what happened last week. You’re pushing insights back into operational systems in near real-time. In healthcare, that might mean care gap alerts flowing into your EHR or denials prevention signals going to your revenue cycle team. In higher ed, it’s at-risk student flags appearing in your advising CRM or personalized outreach campaigns triggered by engagement data. For government, it’s the automated routing of high-priority service requests or predictive maintenance alerts for infrastructure.
And you’re ready for AI. You have curated datasets and feature tables that are clean, documented, and safe for model training. You’ve established secure zones for experimentation with clear guardrails around sensitive data. You’re tracking model drift and data quality for any predictive or generative AI use cases, and you’re measuring business impact, not just technical metrics. You have frameworks in place to move from proof of concept to production quickly and responsibly. Your Analytics & AI services are embedded into daily operations, not sitting in a pilot phase.
Your cost observability is strong. You know your spend per department, per query, and per dashboard. You have a quarterly review process where you measure adoption, retire unused assets, and prioritize new data products based on ROI. Leadership sees the data team as a value driver, not a cost center.
Maturity Comparison at a Glance of AI Readiness
Capability
Lots of Work to Do
A Little Behind
Right on Track
Single source of truth (EHR/SIS/ERP/CRM)
❌ Siloed systems
⚠️ Partial consolidation
✅ Fully unified
Documented metrics & semantic layer
❌ No standards
⚠️ Inconsistent definitions
✅ Single source of truth
Data quality tests & lineage
❌ Manual checks
⚠️ Ad-hoc testing
✅ Automated & traceable
RBAC + PII/PHI/FERPA tagging
⚠️ Minimal controls
⚠️ Partial enforcement
✅ Full compliance + audit
Activation to operational tools
❌ No integration
⚠️ Limited syncs
✅ Real-time activation
Cost & usage observability
❌ No visibility
⚠️ Basic tracking
✅ Full transparency
AI-ready infrastructure
❌ Not prepared
⚠️ Pilot stage
✅ Production frameworks
Legend: ❌ Missing or minimal | ⚠️ Partial or inconsistent | ✅ Complete and mature
Common Pain Points Across Systems
Regardless of which bucket you’re in, certain pain points show up again and again when your stack isn’t where it needs to be.
Disconnected systems are the most common issue. Your EHR doesn’t talk to your claims platform. Your SIS is separate from your LMS and CRM. Your ERP is isolated from your grants management and constituent service tools. Every time you need a complete picture, you’re stitching together exports and hoping the joins are right.
Conflicting definitions create endless friction. What counts as an active patient, an enrolled student, or a resolved service ticket? Different departments have different answers, and no one has written anything down. This leads to endless meetings where people argue about whose numbers are right instead of making decisions.
Compliance anxiety keeps you up at night. You know you need to protect PHI, PII, and FERPA-protected data, but you’re not confident you know who has access to what. Audit trails are incomplete, and when auditors or regulators come calling, you’re scrambling to pull together documentation.
Slow time to insight frustrates everyone. When leadership asks a question, it takes days or weeks to answer because you’re starting from scratch every time. There’s no self-serve capability, so every request becomes a custom project for your already overwhelmed data team.
Rising costs with unclear value are a growing concern. Your cloud data warehouse bill keeps growing, but you’re not sure what’s driving it. You have dozens of dashboards, but you don’t know which ones people actually use. You’re paying for tools that might be redundant, but no one has time to audit and consolidate.
And AI unreadiness is the newest pressure point. Everyone is talking about AI, and leadership is asking what you’re doing with it, but your data isn’t in a state where you can responsibly train models or deploy AI use cases. You don’t have clean feature tables, you don’t have drift monitoring, and you don’t have secure zones for experimentation.
System-Specific Challenges by Sector for AI Readiness
Finance ↔ Program Data, 311 ↔ Work Orders, Grants ↔ Outcomes
Service routing, program transparency, cost-per-outcome
What Good Looks Like in Practice for AI Readiness
When your stack is right on track, the difference is tangible. In healthcare, your clinical and operational teams have real-time visibility into quality metrics, capacity, and revenue cycle performance. Denied claims are flagged before they’re submitted. High-risk patients are identified early, and care coordinators get next-best-action recommendations directly in their workflow. Your data supports value-based care contracts because you can measure and report outcomes reliably.
In higher education, your enrollment funnel is instrumented end-to-end. Admissions knows which programs and campaigns are driving yield. Advising teams get early alerts when students show signs of disengagement in the LMS. Financial aid and student accounts have a unified view of each student’s journey. Advancement teams can target alumni outreach based on engagement and giving history. And you can forecast enrollment and revenue with confidence because your definitions are consistent and your data is fresh.
In state and local government, your department heads have dashboards that show program performance and cost per outcome. Constituent service requests are routed intelligently based on priority and capacity. Public safety teams can analyze incident patterns to deploy resources more effectively. Capital projects have full spend and timeline transparency. And when it’s time to report to state or federal agencies, the data is already there, tested, and auditable.
Across all three sectors, your data team is focused on strategy instead of firefighting. Self-serve BI means business users can answer their own questions. Governance is built in, not bolted on. Costs are predictable and tied to value. And AI use cases are moving from pilots to production because the foundation is solid.
Where Do You Go From Here for AI Readiness?
If you scored yourself and realized you have lots of work to do, you’re not alone. Most organizations in healthcare, higher ed, and government are still in the early stages of data maturity. The good news is that the path forward is clear, but it requires expertise to navigate the complexity of your systems, compliance requirements, and organizational priorities.
If you’re a little behind, you’ve built the foundation, but now you need to focus on governance, activation, and cost control. That means implementing a semantic layer, enforcing access policies, adding lineage and quality tests, and pushing insights back into the operational tools your teams use every day. This is where data strategy consulting becomes critical to avoid costly missteps.
And if you’re right on track, your focus should be on optimization and innovation. That means tightening cost observability, expanding AI use cases with strong guardrails, and treating data as a product with clear ownership, SLAs, and lifecycle management.
The question isn’t whether your data stack needs to evolve. It’s whether you’re going to take control of that evolution or let it happen to you. If you’re ready to assess where you stand, identify your biggest gaps, and build a roadmap tailored to your systems and priorities, contact our team to get started.
Frequently Asked Questions about Readiness
What’s the quickest path to value for organizations just getting started? Consolidate your core systems into a single source of truth, define your golden metrics with clear ownership, and publish three dashboards everyone trusts. Then layer in governance and activation to operational tools.
How do we avoid tool sprawl and runaway costs? Start with a reference architecture and a metrics catalog. Track usage and cost per query. Sunset underused datasets and dashboards quarterly. Make sure every tool has a clear owner and measurable ROI.
How should we treat sensitive data like PHI, FERPA-protected records, and PII? Classify data at ingestion, enforce role-based access controls with full audit logs, and use de-identified or limited datasets for analytics work. Compliance should be built into your pipelines, not bolted on afterward.
When should we invest in advanced analytics and AI Readiness? After you have reliable pipelines, consistent definitions, and strong access controls in place. Begin with use cases tied directly to revenue, cost savings, or service outcomes. Measure business impact, not just technical performance.
What KPIs prove the stack is working? Reliability metrics like percentage of pipelines on time, adoption metrics like weekly active BI users, time-to-insight for new requests, and outcome metrics specific to your sector like denied claims reduction, enrollment yield lift, or service ticket resolution time.
The fastest news in tech right now is not a new tool. It is the pace of large vendors partnering to bring compute, software, and services together in one place. Oracle is deepening its work with Nvidia. Google is doing the same. These moves change how quickly teams can move from a pilot to production AI Alliances. This article explains what is new, why it matters, and where Arc Analytics fits. For a view of our services, start here: Arc Analytics Services.
What is actually new within the AI Alliances?
Oracle and Nvidia are making Nvidia’s software stack available inside the Oracle Cloud console. Teams can select optimized services, spin up tested recipes, and connect to database features that now support search on vectors. Oracle also signals that the next wave of chips will be available across its regions, with larger clusters and faster links.
Google and Nvidia continue to align on hardware, training frameworks, and content checks. Workloads built with familiar open source tools run more efficiently on Nvidia hardware in Google Cloud. There is also progress on watermarking of generated content to help track sources.
Oracle is also partnering with AMD. This matters because it widens choice and can reduce wait times for capacity. It also encourages teams to design for more than one type of chip from the start.
Why this matters to buyers
These alliances shorten the time between an idea and a live service. You get curated building blocks inside the cloud consoles, tested reference paths, and simpler billing. You also get clearer choices for sensitive workloads, since sovereign and government regions are part of the story. The tradeoff is that capacity planning and cost control matter more than ever. You will want a plan that can move across vendors, across chip families, and across regions without a redesign.
Foundation first
Speed only helps if your basics are solid. Most projects stall because data is scattered, definitions are unclear, and access rules are loose. Before you ride the wave of new services, put the ground in order.
Centralize the highest value domains and automate the refresh.
Write down how core metrics are calculated and publish them.
Set ownership for data quality, access, and change control.
What the AI Alliances can change in the next 6 to 12 months
Procurement moves earlier. Reservation windows and capacity queues will shape timelines.
Architecture needs portability. Design for multiple chip options and containerized runtimes that can shift without code rewrites.
Search moves into the database. Features for vector search inside Oracle Database reduce custom glue code.
Content checks are becoming table stakes. Watermarking and traceability will show up in reviews and audits.
Where each alliance fits
Scenario
Why it helps
What to check
Regulated or sovereign workloads
Oracle with Nvidia offers regions and controls that match strict rules
Residency needs, review cycles, audit trails
Fast pilot to production on Nvidia stack
Recipes and ready services in the Oracle console speed delivery
Latency targets, cost caps, on-call readiness
Open source training and research
Google with Nvidia optimizes common frameworks at scale
Framework fit, training time, data egress
Price and capacity flexibility
Oracle partnering with both Nvidia and AMD widens options
Queue times, chip mix, contract terms
How Arc Analytics turns AI Alliances into outcomes
Platform and workload fit
We compare Oracle Cloud, Google Cloud, and hybrid layouts for your use cases. You receive a reference design, cost model, and a plan for capacity.
Data readiness and modeling
We connect sources, model core tables, set refresh schedules, and prepare search features using vectors when needed. See our Data Services page for the full scope.
Deployment engineering
We stand up containerized services, wire run logs and alerts, and create simple rollbacks. If your reporting layer runs on Qlik, we also connect models to dashboards. See Qlik Services.
Governance and risk
We define roles, access, and change control. We document metric logic, lineage, and review steps. See Data Governance.
Staffing support
When you need extra hands, we provide architects, data engineers, and analysts. See Staffing.
A practical 90-day plan for your own AI Alliances
Phase
Timeline
Key Activities
Value Delivered
Assess and align
Days 0 to 30
Map current systems and data flows. Select one high value use case. Draft target architecture across Oracle, Google, or hybrid.
Stakeholder alignment on priority use case. Reference design with portability. Initial cost model.
Build the core
Days 31 to 60
Centralize core data sets with automated refresh. Publish metric definitions and tests. Reserve capacity and prepare runtime environments.
Live data foundation with passing tests. Published data dictionary. Capacity secured and cluster ready.
Ship and benchmark
Days 61 to 90
Deploy one production workflow with monitoring and rollback. Benchmark cost and performance across two vendor options. Publish access model and governance checklist.
Production use case live with SLOs. Cost per query tracked. Benchmark report across vendors. Governance in place.
What good looks like at day 90
Area
Outcome
Proof
Live workflow
One production use case with support coverage
SLO dashboard and on-call rotation
Data clarity
Shared metric logic and dictionary
Public page with version history
Cost and capacity
Monthly report on cost per query and queue times
Benchmarks across at least two vendor options
Governance
Access roles and change log in place
Review notes and approvals
How the AI Alliances Position You
You gain a clean base, clear definitions, and a small set of live services that prove value. You also gain a design that can shift across vendors without starting over. This reduces risk when prices move or when a region fills. It also prepares you to use new features faster, since your data and models are already in order.
Where Arc Analytics Adds Value
We keep current on vendor moves, so your plan reflects the latest choices from Oracle, Nvidia, Google, and AMD.
We translate news into a design you can run. Our focus is the pipeline, the model logic, the access rules, and the dashboard that the business trusts.
We help you avoid narrow choices that lead to lock in. From the start, we design for portability across chips, regions, and clouds.
If you want a plan that fits your business and takes advantage of these alliances without locking you in, start with a short assessment. You will get a readiness score, a target design, and a cost view you can share with leadership. Contact us at Arc Analytics.
Arc Analytics is a full-service data analytics and integration consultancy based in Charlotte, NC, USA, specializing in the Qlik platform. Browse the posts below for practical Qlik tips, migration guidance, and real-world use cases from our consulting work.