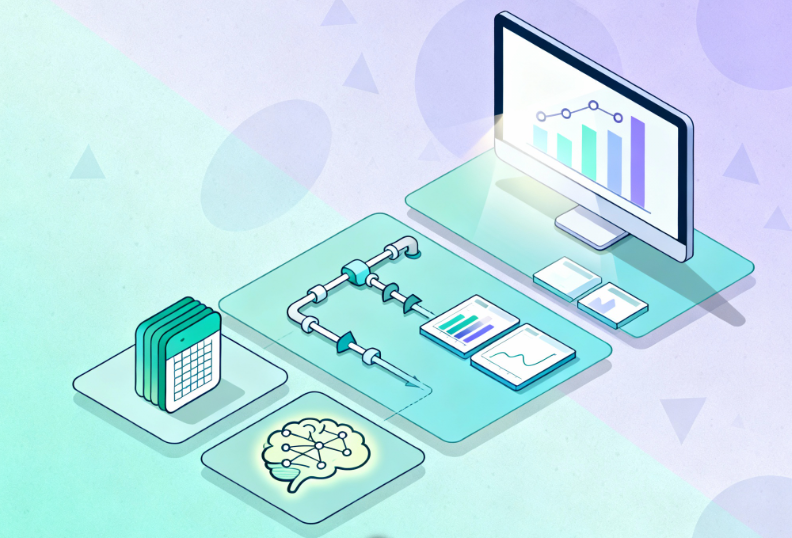
“AI reporting” is everywhere. Vendors promise magic; dashboards claim to be AI‑powered. But most organizations don’t need a science experiment; they need trusted, timely decisions. If your team is still stitching together spreadsheets from ERP, CRM, databases, and exports, AI won’t fix that. It will amplify it.
This post clarifies what AI reporting really is, what it isn’t, and the practical (and profitable) path to get there—without the buzzword bingo.
The Problem With the Hype
- Ambiguous promises lead to misaligned expectations and stalled initiatives.
- Teams operate in silos and rely on manual refreshes, so no one trusts the numbers.
- Leaders buy “AI” before fixing foundations (integration, governance, adoption).
- Result: expensive tools, low adoption, and insights that arrive too late to matter.
Why This Matters Now
AI isn’t just another tool category. When done right, it:
- Improves decision‑making with explainable drivers and predictive signals.
- Reduces cost by automating repetitive reporting work.
- Creates competitive advantage by surfacing opportunities and risks earlier.
But without a solid data foundation, AI becomes a megaphone for bad data. The path to value is sequential, not magical.
What “AI Reporting” Actually Means
AI reporting is analytics augmented by machine intelligence to:
- Surface anomalies and outliers you’d otherwise miss.
- Explain KPI drivers (why something changed and what’s contributing).
- Forecast trends with probabilistic confidence ranges.
- Recommend next best actions or segments to target.
- Answer natural‑language questions (NLQ) against governed data.
Think of AI as an accelerator on good data and sound models, and not a substitute for them.
What It Doesn’t Mean
- Replacing strategic thinking or domain context.
- Magically fixing messy, incomplete, or siloed data.
- Instant ROI without integration, governance, and user enablement.
- Fully autonomous decision‑making across the business.
The AI Reporting Maturity Path
Use this to align stakeholders and prioritize investments. It’s a staircase, not a leap.
Infographic concept (for your design team)
A four‑step staircase or pyramid labeled: 1) Spreadsheets & Manual, 2) Automation & Integration, 3) Real‑Time Dashboards, 4) AI‑Driven Insights. Add brief captions under each step (chaos → consistency → visibility → prediction).
Comparison table
| Stage | What You Have | Risks If You Stop Here | What Unlocks Next Stage |
| Spreadsheets/Manual | CSVs, copy/paste, monthly decks | Errors, delays, no single source of truth | Connect ERP/CRM/DBs/APIs; standardize definitions |
| Automated & Integrated | Scheduled refresh, pipelines, governance | Faster but still reactive | Real‑time dashboards + event‑driven alerts |
| Real‑Time Dashboards | Live KPIs, alerts, shared access | Limited foresight | Add AI: anomaly detection, forecasting, NLQ |
| AI‑Driven Insights | Explanations, forecasts, recommendations | Change management/adoption | Training, guardrails, iterate on high‑ROI use cases |
Use Cases That Work Right Now with AI Reporting
These are practical, budget‑friendly entry points that prove value in 30–90 days.
| Function | AI Assist | Business Impact |
| Finance | Forecast + variance drivers | Faster, more confident decisions; fewer surprises |
| Sales/RevOps | Deal and pipeline risk scoring | Higher win rates; better focus on at‑risk deals |
| Operations | Anomaly detection on throughput/inventory | Lower waste; better service levels and OTIF |
| Executive | NLQ on governed KPIs + proactive alerts | Faster alignment; fewer status meetings |
Prerequisites Most Teams Skip
Before you pilot AI reporting, confirm these boxes are checked:
- Data integration across ERP/CRM/databases/APIs to eliminate silos
- Data quality, lineage, and access controls so people trust the numbers
- Automated refresh, monitoring, and incident alerts to replace manual reporting
- Enablement and adoption plans so humans + AI actually work together.
- Governance guardrails for responsible AI (auditability, bias, privacy).
External perspective: this Forbes article on data‑driven decision making highlights how organizations translate data into action when foundations are in place.
How Arc Analytics Helps AI Reporting
Arc is your end‑to‑end partner for the maturity path—from spreadsheets to explainable AI.
- Assessment: AI reporting readiness across data, governance, and adoption.
- Architecture: pipelines, models, and controls designed for scale.
- Implementation: integrate sources, build live dashboards, deploy AI features.
- Change management: training, playbooks, and success metrics that stick.
- Ongoing optimization and roadmap aligned to your highest‑ROI use cases.
Need specialized talent to accelerate? We also offer Data & AI Staffing and an active Careers portal to augment your team.
Why Qlik Cloud Fits AI Reporting
Qlik Cloud provides the governed, scalable backbone for AI‑ready analytics:
- Native integrations to ERP/CRM/databases/Excel/APIs with reusable models.
- Insight Advisor for NLQ and explanations; forecasting and anomaly detection.
- Automation to eliminate manual report building and distribution.
- Real‑time dashboards and alerting so decisions match the moment.
- Enterprise‑grade governance to keep AI explainable and compliant.
Learn more about our approach on Qlik Services.
Stop buying buzzwords. Start building advantage.
- Get an AI Reporting Readiness assessment.
- Prioritize 1–2 use cases with provable ROI in 90 days.
- Scale what works across functions.
Ready to move from hype to impact? Talk to Arc or explore how we partner with teams on Services.

