Organizations today are overwhelmed with data. They invest heavily in sophisticated analytics tools, build intricate data pipelines, and craft beautiful dashboards. Yet, despite all this effort, a common and frustrating problem persists: non-technical users often feel lost without training. They struggle to understand what the numbers mean, which reports to trust, or how to apply insights to their daily work.
This is more than a minor inconvenience. When users are confused, they either avoid data altogether or constantly ping the data team with questions. This turns valuable data professionals into a support desk, diverting them from strategic initiatives. The real challenge is not only about building better dashboards; it is about building better data literacy and confidence among the people who need to use that data every day.
One practical way to solve this is by pairing your data stack with a dedicated community platform. That is exactly why we created our Skool community, Arc Academy for Qlik. It is a space where Qlik users and data teams can learn together, share best practices, and turn confusion into clarity.
The Real Data Challenge Is Not Dashboards, It’s Training People
Many organizations believe that if they just build enough dashboards, users will magically become data-driven. The reality is far more human. Non-technical users face a specific set of anxieties:
“I don’t know which report to trust; they all show slightly different numbers.”
“I’m afraid I’ll pull the wrong number and make a bad decision.”
“What does this metric actually mean, and how is it calculated?”
“Where do I even start when I need to find information?”
These anxieties lead to real business impacts. Decisions slow down as people second-guess data or revert to gut feelings. Valuable insights remain locked away in underused reports. The data team is constantly interrupted with repetitive requests, which limits their ability to drive strategic value.
Services like data analytics and data engineering can perfect your data pipelines. But if the people who rely on that data do not feel confident using it, the investment will never fully pay off. That is where a community like Arc Academy for Qlik becomes a force multiplier. It connects people with similar questions and challenges so no one has to figure it out alone.
Why Traditional Training Fails Non-Technical Users
The typical approach to data education often falls short. One-time training sessions, while well-intentioned, rarely stick. Information overload means most details are forgotten within days. Static documentation, whether in PDFs or internal wikis, quickly becomes outdated and is rarely consulted. New hires face a steep learning curve with no easy, centralized way to understand your unique metrics and reports.
This cycle leads to the same questions being asked repeatedly across different channels, creating inefficiency and frustration for both data providers and data consumers.
Here is a simple comparison of the old way versus a community-first approach:
Area
Traditional Training
Community-First Approach (Arc Academy for Qlik)
Content Access
One-off sessions, PDFs
Always-on video, posts, and Q&A
New Hire Onboard
Ad hoc explanations
Guided learning paths and pinned lessons
Questions
Private DMs and email
Public threads others can learn from
Updates
Hard to keep docs in sync
New posts, comments, and notifications
In Arc Academy for Qlik, questions and answers are shared openly. That means every answer helps dozens or hundreds of people, not just one.
Using Community to Teach Data in Plain Language
A Skool community like Arc Academy for Qlik acts as a dynamic, always-on classroom and support hub for Qlik users and data consumers. It is a place where complex data concepts are broken down into straightforward, plain language explanations.
Inside a community like this, you can expect:
Short posts explaining key metrics and Qlik concepts in simple terms.
Screen recordings that walk through real dashboards step-by-step.
Examples of how different teams use Qlik to solve everyday problems.
The focus is on clarity, not jargon. For organizations working in sectors like government, healthcare, or education, this means explaining metrics that directly relate to your world. For instance, reporting tied to government data analytics services, healthcare analytics, or education analytics can be broken down with relatable examples.
When these explanations live in a community instead of a static document, they can be updated, discussed, and improved over time.
Turning One-Off Questions Into Reusable Learning
One of the biggest wins of a community platform is how it converts individual questions into shared knowledge.
In Arc Academy for Qlik, for example:
Someone posts a question about a Qlik app, metric, or best practice.
An expert or another community member shares an answer, often with screenshots or a brief video.
That thread is now searchable and available to everyone, not just the original poster.
Over time, the most helpful threads can be turned into curated resources, pinned posts, or structured mini-courses. Instead of your data team answering the same question over and over in private channels, the community builds a living knowledge base that keeps getting better.
This “strength in numbers” effect is powerful: each person’s question improves the experience for the whole group.
Designing Spaces Around Real Roles and Use Cases
To make a community useful, it should mirror the way people actually work. Organizing content by tool alone is not enough. It is far more effective to organize by role, workflow, or business problem.
In Arc Academy for Qlik, that might look like:
Spaces focused on leaders and how they should read executive dashboards.
Areas where finance or operations teams can dive into KPIs that matter most to them.
Threads highlighting specific use cases from the public sector, healthcare, or education.
This role-based structure matches how Arc Analytics builds solutions in client environments. Whether you are consolidating data sources or deploying Qlik at scale, your users need to see themselves and their challenges reflected in the way learning is organized.
Measuring the Impact of a Data Community Training
A community should not just feel good; it should deliver results. You can measure the impact of a Skool community like Arc Academy for Qlik by tracking:
Fewer repetitive questions to the data or BI team.
More active users in Qlik and other analytics tools.
Shorter onboarding time for new hires who need to work with data.
Better alignment on “one version of the truth” for core KPIs.
You can also look at community analytics such as active members, post engagement, and course completion rates. Combined with product usage data, this paints a clear picture of how community participation supports data adoption and better decisions.
How to Get Started Without Overwhelming Your Team
The good news is that you do not have to build your own community from scratch. You can plug into an existing one.
A simple way to start is to join Arc Academy for Qlik:
Explore real questions other Qlik users are asking.
Learn from shared examples, templates, and best practices.
Bring your own questions and challenges and get feedback from both peers and experts.
By joining an established community, your team benefits from a broader network. You are not just learning from your own use cases; you are learning from dozens of organizations that are solving similar problems in different ways. That is the power of strength in numbers.
Moving Forward: Build Confidence Through Training, Not Just Dashboards
Your data challenges are not just technical; they are human. Tools like Qlik are incredibly powerful, but without confidence and understanding, they will never reach their full potential.
A community like Arc Academy for Qlik gives users a safe, structured, and collaborative environment to learn, ask questions, and grow. It turns your data journey into something shared, not something every team has to figure out on its own.
At Arc Analytics, we help clients build strong data foundations and the human systems that sit on top of them. If you want your investment in Qlik and analytics to translate into real-world adoption, joining a community is one of the fastest ways to accelerate that progress. Join Arc Academy for Qlik today and see how much easier data becomes when you are not learning it alone.
Most businesses run on three core systems: ERP for operations, CRM for customers, and BI for insights. Without ERP, CRM, and BI Data Integration, data gets trapped in silos and critical context is lost. Effective data integration connects these systems so information flows in real time, reducing manual work and errors. When your tools share a single source of truth, teams make faster, smarter decisions and deliver a smoother customer experience. This is how you turn disconnected activity into coordinated growth.
Picture this: Your sales team closes a big deal in the CRM, but your warehouse doesn’t know about it until someone manually updates the ERP. Meanwhile, your BI dashboard shows last week’s numbers because it can’t pull real-time data from either system.
Sound familiar? Here’s what data silos are costing you:
• Duplicate work and manual data entry
• Inconsistent reports across departments
• Delayed decisions based on outdated information
• Frustrated teams working with incomplete data
• Missed opportunities to serve customers better
This fragmented approach doesn’t just waste time—it actively hurts your ability to compete and grow.
Operational Excellence: When Data Integration Works Together
Imagine a different scenario. A customer places an order through your sales team, and instantly:
• Inventory levels update automatically in your ERP
• Production schedules adjust if needed
• Shipping timelines appear in real-time
• Customer service gets full order visibility
• Finance sees revenue impact immediately
This isn’t wishful thinking—it’s what happens when your systems are properly integrated. The result? Smoother operations, fewer errors, and teams that can focus on strategy instead of data entry.
When your CRM and ERP share data, something powerful happens—you see the complete customer story:
CRM Data
ERP Data
Combined Insight
Sales interactions
Order history
Customer buying patterns
Marketing campaigns
Shipping details
Campaign effectiveness
Service tickets
Payment history
Customer satisfaction drivers
Lead sources
Product preferences
Best acquisition channels
This unified view lets your team:
• Personalize every customer interaction
• Predict what customers need before they ask
• Identify upselling and cross-selling opportunities
• Resolve issues faster with complete context
Strategic Decisions: BI That Actually Works
Your BI tools are only as good as the data they can access. When connected to integrated ERP and CRM data, your dashboards transform from pretty charts into strategic weapons:
• Track real-time KPIs across all departments
• Spot trends before your competitors do
• Measure the true impact of marketing campaigns
• Understand which customers drive the most profit
• Make decisions based on complete, accurate data
For example, integrated data might reveal that customers acquired through social media campaigns have 40% higher lifetime value—but only if they purchase within their first 30 days. That’s the kind of insight that drives real business growth.
Making Data Integration Happen
Getting your systems to work together doesn’t have to be overwhelming. Here’s how successful organizations approach it:
Assessment & Planning
Start by mapping your current data flows and identifying the biggest pain points. Where are teams spending the most time on manual work? Which decisions are delayed by missing data?
Choose Your Integration Approach
Native integrations: Use built-in connections when available
Middleware solutions: Deploy integration platforms for complex scenarios
Modern data platforms: Leverage cloud-based tools for scalability
Focus on Business Value
Don’t integrate everything at once. Start with the connections that will have the biggest impact on your operations, customer experience, or decision-making.
Need help getting started? Contact our team to discuss your integration strategy.
The Bottom Line for Data Integration
Breaking down data silos isn’t just about technology—it’s about unlocking your organization’s potential. When your ERP, CRM, and BI tools work together, you get:
Faster operations with automated data flows
Happier customers through personalized experiences
Smarter decisions based on complete information
Competitive advantage through data-driven insights
The question isn’t whether you can afford to integrate your systems—it’s whether you can afford not to. Start your integration journey today and discover what your data can really do.
In the complex and critical realm of public safety, timely and insightful data is the bedrock of effective decision-making. From anticipating potential threats to optimizing emergency responses, the ability to rapidly analyze vast amounts of information can quite literally save lives and improve community well-being. This is where Qlik Cloud Analytics steps in, transforming raw data into actionable intelligence that empowers school systems, law enforcement, emergency services, and community leaders.
At Arc Analytics, we’ve seen firsthand how integrating diverse data sets within Qlik Cloud can create a truly powerful picture of public safety dynamics. To illustrate this, we’ve created a unique demonstration that weaves together seemingly disparate data points, providing an unprecedented level of insight into community safety.
Unveiling Insights: A Multi-Layered Look at Community Safety
This demonstration uses Qlik Cloud to visualize complex public safety scenarios, combining publicly available data from across Florida. Almost every layer of data shown is publicly available, but it also contains critical information for understanding safety concerns. These datasets include:
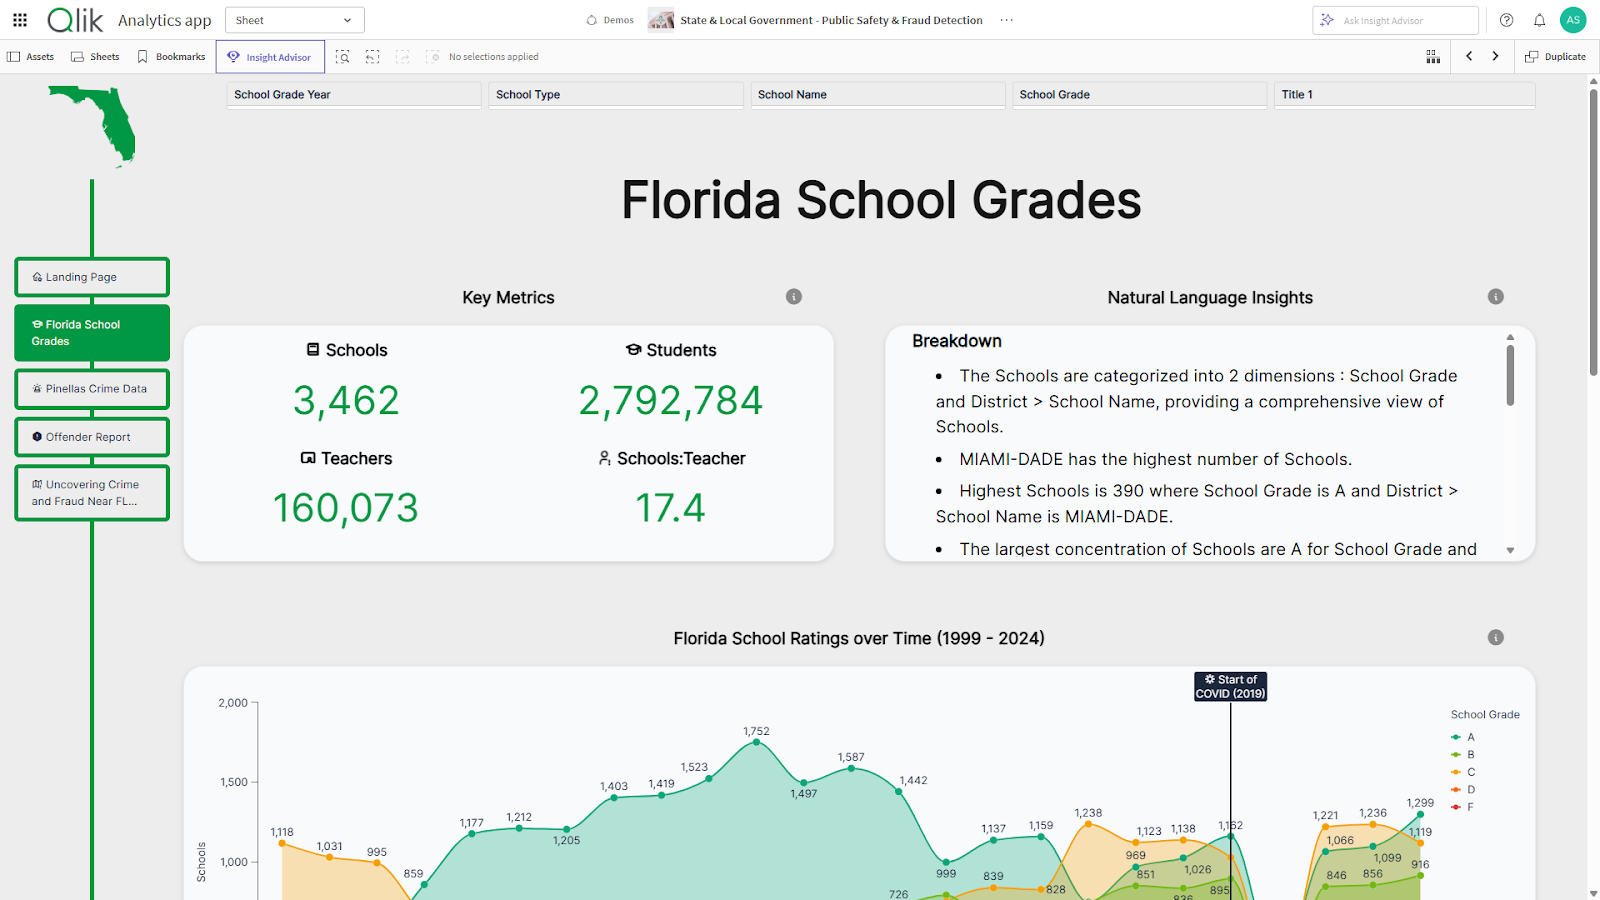
Florida School Grading System (1999-2023): One layer presents the entire state of Florida’s public school grading system from 1999 to 2023. You can see the grades and precise locations of schools across the state, allowing you to gauge educational performance visually.
Pinellas County Crime Data (Last 10 Years): Superimposed on this, another layer displays Pinellas County crime data for the last decade. This isn’t just dots on a map; it’s a dynamic heat map that visually represents the severity of crime, indicating when and where incidents occurred. This gives a visceral sense of criminal activity patterns.
Pinellas County Sex Offender Locations: Perhaps one of the most impactful layers shows the locations of all registered sex offenders in Pinellas County. What makes this particularly compelling is the interactive element: when you hover your cursor over an offender’s location, their mugshot instantly appears.
Pinellas County Bus Routes: A crucial layer reveals the bus routes of Pinellas County. By toggling this on, you can see the lines on the map, allowing for a visual correlation between public transportation arteries and areas with higher crime rates. This insight can be vital for understanding movement patterns and potential vulnerabilities.
Pinellas County SNAP Locations:An open data source that shows each eligible location in Florida that accepts SNAP benefits for the program recipient.
The Critical Role of Monitoring Public School Education in Community Safety
Tracking the educational performance of public schools is vital for understanding community well-being and long-term public safety. By monitoring school grades and trends, stakeholders can identify areas needing support, allocate resources more effectively, and address underlying issues that may impact youth outcomes. Data-driven insights into education not only help improve academic achievement but also contribute to safer, more resilient communities by empowering early intervention and informed decision-making.
Public safety agencies often face the challenge of deploying limited resources to cover vast and dynamic areas. Qlik Cloud provides the analytical horsepower to make these critical decisions with precision:
Dynamic Deployment Strategies: By integrating crime data, population density, historical incident reports, and even real-time events, Qlik Cloud allows commanders to visualize hotspots and allocate police patrols, fire services, or emergency medical teams more effectively.
Staffing Optimization: Analyzing call volumes, response times, and incident types helps agencies determine optimal staffing levels and shift schedules, ensuring adequate coverage where and when it’s most needed.
Infrastructure Planning: Understanding the correlation between infrastructure (like bus routes, as seen in the demo) and incident patterns can inform decisions about where to increase surveillance, improve lighting, or adjust public transport schedules to enhance safety.
Pattern Recognition: The ability to layer data like school locations, crime hotspots, and known offender residences helps identify subtle patterns that might indicate elevated risks in certain areas or times. This allows for targeted community engagement or increased presence.
Intervention Program Effectiveness: By tracking the locations and characteristics of crime, agencies can evaluate the effectiveness of community programs, youth outreach, or neighborhood watch initiatives. Qlik can show if interventions in specific areas are truly leading to a reduction in incidents.
Risk Area Identification: The demo’s ability to show sex offender locations relative to schools and homes is a prime example of how Qlik can highlight vulnerable areas, allowing for informed alerts to school officials, parents, and community members.
Overview of crime data within Pinellas County
Enhancing Emergency Response and Coordination
In emergencies, every second counts. Qlik Cloud facilitates faster, more informed responses:
Real-time Situational Awareness: By integrating live feeds from sensors, traffic cameras, and dispatch systems, Qlik Cloud can provide first responders with real-time dashboards showing the evolving situation, allowing for quicker decisions on routes, hazards, and necessary resources.
Incident Command Support: During large-scale emergencies, Qlik applications can consolidate information from multiple agencies (police, fire, medical, public works) into a single, intuitive view, enhancing coordination and resource deployment.
Post-Incident Analysis: After an event, Qlik Cloud allows for thorough analysis of response times, resource utilization, and outcomes, providing invaluable lessons for future emergency planning and training.
This powerful mapping tool allows users to toggle each layer on and off, revealing a dynamic narrative of public safety. For instance, a school district official or a concerned parent can easily visualize the proximity of a registered sex offender to their nearest school or even their home location. This immediate, visual insight provides a critical understanding of potential risks that text-based reports simply cannot convey.
The real underlying point of this demo, even though it utilizes publicly sourced data to paint a vivid picture, is this: by providing more and more data sources with deeper aspects of knowledge, you can enable better decision-making no matter your position, role, or concern for public safety. It’s about empowering everyone with the insights they need.
Geometry lines of 20-minute walking distance to school, sex offenders (with mugshot), and SNAP Benefit in downtown St Petersburg
The Power of Data Collaboration for a Safer Tomorrow
The true strength of Qlik Cloud in public safety lies not just in its individual analytical capabilities but in its ability to foster data collaboration. Public safety is rarely the responsibility of a single entity. It involves complex interactions between law enforcement, fire departments, emergency medical services, local government, schools, and community organizations.
Qlik Cloud provides a unified, secure platform where these diverse stakeholders can share, visualize, and collaborate on critical data. This breaks down traditional information silos, enabling:
Cross-Agency Insights: Police departments can share crime trends with school districts, allowing for joint safety initiatives. Emergency services can share incident data with urban planners to identify areas needing better infrastructure.
Informed Community Engagement: By making relevant, aggregated data accessible to the public, as demonstrated by the school performance aspects of this demonstration, it fosters greater community trust and encourages informed citizen participation in safety efforts.
Proactive Policy Making: Legislators and city planners can use these comprehensive datasets to inform policy decisions, allocate budgets, and design safer communities based on clear evidence rather than assumptions.
Partnering for Public Safety with Arc Analytics
At Arc Analytics, we are dedicated to helping public safety agencies and communities harness the full potential of Qlik Cloud. This example is just one powerful, actionable insight that can be gleaned when data is integrated and visualized effectively. We understand the sensitive nature of public safety data and ensure that our solutions adhere to the highest standards of security and compliance.
We work closely with organizations to:
Integrate Disparate Data Sources: Bringing together information from police records, school systems, public transportation, and other critical databases.
Develop Custom Analytical Applications: Building tailored Qlik solutions that address your specific public safety challenges and objectives.
Provide Expert Implementation and Training: Ensuring your teams are proficient in using Qlik Cloud to drive continuous improvements in public safety.
By transforming raw data into clear, actionable intelligence, Qlik Cloud Analytics, supported by Arc Analytics’ expertise, empowers public safety professionals and concerned citizens alike to make better decisions, protect communities, and build a safer future for everyone.
Ready to see the power of Qlik Cloud Analytics in action? Schedule a full demo with our team today and discover how data-driven insights can transform public safety in your community.
Qlik doesn’t really allow for icons. When creating dashboards in Qlik Cloud, it can be very helpful to add icons to spruce up KPIs, titles, and tables. There are hundreds of use cases for adding some visual flair using icons, but it can be cumbersome to add icons to objects in Qlik because there are very few built-in icon options.
So, how can we go about adding some icons to our dashboards in an easy and expressive way?
We can use a font! But wait, we’re talking about icons, not text. So how will a font help us? It turns out that fonts can pack in far more than just standard characters like letters, numbers, and punctuation. One example of a “supercharged” font is Tabler Icons.
Tabler Icons is an open source project that bundles thousands of beautiful icons into multiple formats that you can use freely in your web projects. One such format is a webfont, specifically .tff which is a TrueType font type.
How can we use this font in Qlik?
We’ll add it to a custom Qlik theme and choose icons in our dashboard using variable expansion with a parameter.
Don’t worry if this doesn’t quite make sense yet! Let’s go through each step now.
Steps to set up
Download Tabler Icon webfont.
We can find the tabler-icons.ttf font file in the Tabler Icons Webfont package on the NPM website:
If you don’t already have a custom theme to add this font to, go ahead and create one based on the instructions laid out on the Qlik Help website. You can also look online for a Qlik theme generator to help get you started.
Add tabler-icons.ttf to the Qlik theme folder.
Move the tabler-icons.ttf file to your custom Qlik theme folder. It should look similar to this:
Add @font-face to the theme CSS file.
Open your theme’s .css file and add this snippet at the top:
ℹ️ Note that in our screenshot above, my snippet includes the Open Sans font, as I want for that to be the primary font for normal characters like letters and numbers. You can replace that with any of the default Qlik Cloud font options:
Upload file to Qlik Cloud or Qlik Sense Client-Managed.
To add your custom theme to Qlik, you must first save the theme folder as a ZIP file.
In the box that appears, click on the hex value to copy it:
Go to the app Sheet view and switch the app theme to use our uploaded theme.
In your Qlik app, select any Qlik object, and then choose an expression property.
For example, you can create or select a bar chart object and then open the expression editor for the Title expression.
In the property’s expression editor, we’ll use dollar-sign expansion with our GetTablerIcon variable and use the our copied Tabler Icon hex code as the parameter.
Make this the expression:
=$(GetTablerIcon(ea59)) & ' Sales by County'
– Then select the Apply button to save that.
You should now see your icon in the chart title!
If your icon doesn’t appear or you see a placeholder character in the chart title where our icon should be, you probably just need to update the font property.
To do this, go to the chart styling tab:
Find the font property we want to change (Title in this example) and then choose the option that includes Tabler Icons:
ℹ️ Note that if you want to “pair” the Tabler Icons font with a primary font that regular characters will use, refer back to step 5.
Summary
You should now be able to use Tabler Icons anywhere in a Qlik dashboard that supports text expressions and changing the font!
That should get you very far.Try changing the font color and size to see how the icons scale very well and can be recolored just like text.
Navigating the world of data analytics can feel like trying to decipher an ancient language. You know the potential is there – those hidden insights that can propel your business forward – but unlocking them often requires a skilled guide. That’s where a data analytics consulting partner comes in. But just like choosing the right travel companion, finding the right partner can make all the difference between a smooth journey and a frustrating detour.This isn’t just about someone setting up a dashboard and calling it a day. A true partner becomes an extension of your team, deeply understanding your unique challenges and working collaboratively to achieve your specific goals. So, what should you really expect from this kind of relationship?
What Should You Be Receiving? It’s More Than Just Deliverables.
When you engage a data analytics consulting partner, you’re not just buying a service; you’re investing in expertise and a collaborative relationship. Here are some key things you should expect to receive:
Flexibility That Fits Your Needs: Forget rigid contracts and pre-packaged solutions. A good partner understands that your needs can evolve. Expect pre-authorized hours that provide budget control while allowing for necessary work to be completed. Think of it as setting a clear boundary, like saying, “Let’s scope this project within 40 hours, and if we need more, we’ll talk.” This demonstrates respect for your budget and ensures transparency. Furthermore, look for flexible service level agreements (SLAs). These shouldn’t be one-size-fits-all. A partner should be willing to tailor SLAs – perhaps a standard four-hour response time for typical requests, which might even adjust to a quicker 30-minute response during critical periods – all tied to clearly defined scopes of work and agreed-upon hourly rates. This adaptability shows they’re truly invested in supporting your business rhythm.
A Consistent and Dedicated Point of Contact: Imagine having to explain your project to a new person every time you reach out. Frustrating, right? Expect a dedicated, 1:1 relationship where you work with a consistent team that builds a deep understanding of your business, your data, and your Qlik Cloud environment. This eliminates the inefficiencies of multiple touchpoints and the impersonal feel of large, impersonal firms relying on offshore subcontractors who may not have the same level of direct investment in your success. You deserve a team that’s in the trenches with you, not just filling out timesheets from afar.
Proactive Partnership, Not Just Order-Taking: A great consulting partner doesn’t just wait for you to tell them what to do. They should be proactive, bringing insights and suggestions to the table based on their understanding of your business and the capabilities of Qlik Cloud. Expect regular check-ins – not just status updates, but strategic conversations about progress, potential roadblocks, and future opportunities. They should be genuinely invested in understanding your specific business goals and tailoring their approach to help you achieve them.
Signs You Might Need a New Qlik Consulting Partner: Don’t Settle for Less.
Are you getting everything you should be from your current data analytics partner? Here are some red flags that might indicate it’s time for a change:
Silence is Not Golden: A lack of proactive communication or consistently missed deadlines are clear indicators that your partner isn’t prioritizing your needs. You shouldn’t have to constantly chase them for updates or feel like your project is on the back burner.
Quote Chaos: Receiving inaccurate quotes or having to constantly request updated pricing signals a lack of attention to detail and can lead to budget surprises. Transparency in pricing is crucial for building trust.
The Price Doesn’t Feel Right: Be wary of price gouging, an unfortunately common practice in technology sales, especially within sectors like state and local government. A trustworthy partner will be upfront and transparent about their pricing and licensing models, ensuring you’re paying a fair market value for the Qlik Cloud products and services. They should be working to get you the best value, not just maximizing their profit at your expense.
Where’s the Innovation?: If your partner isn’t bringing innovative solutions or demonstrating a deep understanding of the latest Qlik Cloud features and how they can benefit your specific industry, you might be missing out. A good partner stays ahead of the curve and helps you do the same.
They Don’t “Get” Your Business: A partner who doesn’t take the time to understand the unique nuances and challenges of your specific industry is less likely to deliver truly impactful solutions. Generic advice won’t cut it.
The Feeling’s Not Mutual: Ultimately, if you feel like your current partner isn’t truly invested in your success, isn’t communicative, or isn’t providing the level of service you expect, it’s a strong sign that it might be time to explore other options.
The Value of Industry Expertise: Why It Matters.
While a broad understanding of data analytics is essential, a partner with proven experience in your specific industry can bring invaluable insights. For example, Arc analytics specializes in education, healthcare, and government sectors, where we’ve developed a deep understanding of the unique data challenges and regulatory landscapes. However, our experience isn’t limited to these verticals. Our history of completing hundreds of projects across several sectors demonstrates our adaptability and ability to apply our Qlik Cloud expertise to diverse business needs. This cross-industry experience allows us to bring best practices and innovative solutions from different fields to your specific challenges.s
Deliverables: Tailored Solutions Designed for You.
Forget the idea of a one-size-fits-all solution. A quality data analytics consulting partner understands that your needs are unique. Expect solutions that are configured and customized to the specific scope of work you define. This means the dashboards, reports, and integrations you receive are designed to answer your specific business questions and track your key performance indicators. While the underlying technology might be consistent, the final deliverables should feel like they were built for you, not just for anyone. We also believe in transparent reporting when it comes to accounting, so you have a clear understanding of the investment you’re making.
Finding the Right Fit: It’s About More Than Just Technology.
Choosing a data analytics consulting partner is a significant decision. It’s about finding a team that not only possesses the technical expertise with Qlik Cloud but also prioritizes clear communication, genuine collaboration, and a deep understanding of your business. You deserve a partner who feels like a natural extension of your own team, dedicated to helping you unlock the full potential of your data. Ready to explore how a dedicated and experienced Qlik Cloud partner can help you achieve your data analytics goals? We invite you to reach out and discover the difference a true partnership can make.Contact our team.
About Blog
Arc Analytics is a full-service data analytics and integration consultancy based in Charlotte, NC, USA, specializing in the Qlik platform. Browse the posts below for practical Qlik tips, migration guidance, and real-world use cases from our consulting work.


")


")