In 2025, the gap between data-driven organizations’ perception of AI Readiness and everyone else is widening fast. Budgets are tighter, expectations are higher, and leadership wants measurable outcomes instead of more tools. For teams working in Healthcare, Higher Education, and State & Local Government, the challenge is even more complex. You’re managing sensitive data across disconnected systems, meeting strict compliance requirements, and trying to deliver better outcomes with fewer resources.
This AI Readiness guide helps you assess where your data stack stands today. You’ll identify which maturity bucket you fall into: Lots of Work to Do, A Little Behind, or Right on Track—and understand the specific pain points holding you back from making data a strategic asset instead of an operational burden.
Quick Checklist for AI Readiness
Before we dive in, take a moment to score yourself on these nine capabilities. Answer yes or no to each:
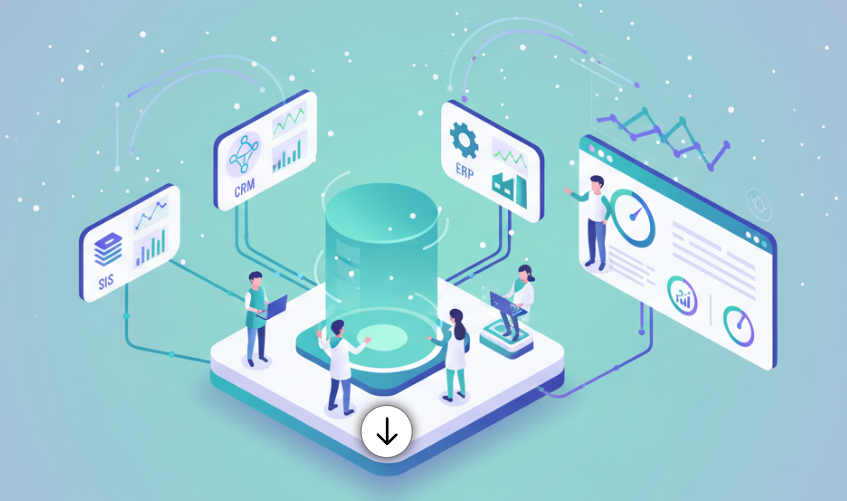
Do you have a single source of truth that consolidates data from your core systems like your EHR, SIS, ERP, CRM, and financial platforms?
Are your data pipelines monitored with clear SLAs so you know when something breaks before your users do?
Have you documented your key metrics and definitions in a way that everyone across departments can reference?
Do you have data quality tests and lineage tracking so you understand where your numbers come from and can trust them?
Are role-based access controls, PII tagging, and audit trails in place to meet compliance requirements?
Can you activate data back into operational tools to drive real-time decisions?
Do you have self-serve BI with governance policies and a process to deprecate unused dashboards?
Is cost observability built in so you can track usage, cost per query, and unit economics?
Do you have secure zones and frameworks ready for advanced analytics and AI use cases?
Scoring: 0–3 Yes: Lots of Work to Do 4–6 Yes: A Little Behind 7–9 Yes: Right on Track
Understanding the Maturity Buckets of AI Readiness
Lots of Work to Do
If you’re in this bucket, you’re likely dealing with data chaos on a daily basis. Your EHR, SIS, ERP, CRM, and financial systems are siloed islands. Data moves between them through manual CSV exports, email attachments, or one-off integrations that break without warning. When leadership asks for a report, it takes days or weeks to pull together, and even then, different departments come back with conflicting numbers because no one agrees on basic definitions.
You don’t have a clear data owner, and there’s no central place where people can go to find trusted metrics. Compliance is a constant worry because you’re not sure who has access to what, and audit trails are either nonexistent or buried in system logs no one ever checks. Your team spends more time firefighting data issues than actually analyzing anything, and trust in your numbers is low across the organization.
The risks here are significant. Poor data leads to poor decisions. Compliance exposure grows every day, according to HIPAA, FERPA, and state data protection standards. You’re likely overspending on tools that don’t talk to each other, and your team is demoralized because they’re stuck doing manual work instead of strategic analysis. If you’re in healthcare, this might mean delayed insights into denied claims or readmissions. In higher ed, it could be conflicting enrollment numbers that make it impossible to forecast revenue. For state and local government, it often shows up as slow responses to constituent requests and no visibility into program performance.
A Little Behind
If you’re in this bucket, you’ve made progress but you’re hitting new bottlenecks. You have a data warehouse or lakehouse that consolidates some of your core systems, but it’s not complete. Your EHR or SIS data might be there, but your CRM, financial aid, grants management, or constituent service platforms are still disconnected. Dashboards exist, but they’re slow, and users complain about stale data or unclear definitions.
You have some governance in place, but it’s ad-hoc. Access controls exist, but they’re not consistently enforced. PII and PHI tagging happens sometimes, but not systematically. When a pipeline breaks, you find out from an angry user instead of a monitoring alert. You’re starting to see your data costs climb, but you don’t have visibility into what’s driving them or which queries and dashboards are the culprits.
The risk here is that you’re stuck in the middle. You’ve invested in data integration and data engineering infrastructure, but adoption is plateauing because users don’t trust the data or find it too slow. Your pipelines are brittle and break when source systems change schemas. Costs are rising faster than value, and you’re not sure where to focus next. In healthcare, this might mean you have quality metrics dashboards, but care teams don’t use them because the data is two days old. In higher ed, you might have enrollment dashboards, but admissions and financial aid are still using different definitions of “yield.” For government, you might have 311 data in a warehouse, but no way to route high-priority tickets automatically.
Right on Track
If you’re in this bucket, your data stack is a strategic asset. You have a consolidated warehouse or lakehouse that brings together your EHR, claims, scheduling, and patient experience data in healthcare. In higher ed, your SIS, LMS, CRM, financial aid, and alumni systems feed a single source of truth. For government, your finance, constituent services, public safety, and program data are unified with clear lineage and ownership.
Your metrics are documented in a semantic layer that everyone references. When someone asks about readmission rates, enrollment yield, or service ticket resolution time, there’s one definition and one dashboard everyone trusts. Data quality tests run automatically, and lineage tracking means you can trace every number back to its source. Role-based access controls are enforced consistently, and sensitive data is tagged and governed with full audit trails that meet ONC Interoperability standards, IPEDS reporting requirements, and open data transparency mandates.
But what really sets you apart is activation and AI readiness. You’re not just reporting on what happened last week. You’re pushing insights back into operational systems in near real-time. In healthcare, that might mean care gap alerts flowing into your EHR or denials prevention signals going to your revenue cycle team. In higher ed, it’s at-risk student flags appearing in your advising CRM or personalized outreach campaigns triggered by engagement data. For government, it’s the automated routing of high-priority service requests or predictive maintenance alerts for infrastructure.
And you’re ready for AI. You have curated datasets and feature tables that are clean, documented, and safe for model training. You’ve established secure zones for experimentation with clear guardrails around sensitive data. You’re tracking model drift and data quality for any predictive or generative AI use cases, and you’re measuring business impact, not just technical metrics. You have frameworks in place to move from proof of concept to production quickly and responsibly. Your Analytics & AI services are embedded into daily operations, not sitting in a pilot phase.
Your cost observability is strong. You know your spend per department, per query, and per dashboard. You have a quarterly review process where you measure adoption, retire unused assets, and prioritize new data products based on ROI. Leadership sees the data team as a value driver, not a cost center.
Maturity Comparison at a Glance of AI Readiness
Capability
Lots of Work to Do
A Little Behind
Right on Track
Single source of truth (EHR/SIS/ERP/CRM)
❌ Siloed systems
⚠️ Partial consolidation
✅ Fully unified
Documented metrics & semantic layer
❌ No standards
⚠️ Inconsistent definitions
✅ Single source of truth
Data quality tests & lineage
❌ Manual checks
⚠️ Ad-hoc testing
✅ Automated & traceable
RBAC + PII/PHI/FERPA tagging
⚠️ Minimal controls
⚠️ Partial enforcement
✅ Full compliance + audit
Activation to operational tools
❌ No integration
⚠️ Limited syncs
✅ Real-time activation
Cost & usage observability
❌ No visibility
⚠️ Basic tracking
✅ Full transparency
AI-ready infrastructure
❌ Not prepared
⚠️ Pilot stage
✅ Production frameworks
Legend: ❌ Missing or minimal | ⚠️ Partial or inconsistent | ✅ Complete and mature
Common Pain Points Across Systems
Regardless of which bucket you’re in, certain pain points show up again and again when your stack isn’t where it needs to be.
Disconnected systems are the most common issue. Your EHR doesn’t talk to your claims platform. Your SIS is separate from your LMS and CRM. Your ERP is isolated from your grants management and constituent service tools. Every time you need a complete picture, you’re stitching together exports and hoping the joins are right.
Conflicting definitions create endless friction. What counts as an active patient, an enrolled student, or a resolved service ticket? Different departments have different answers, and no one has written anything down. This leads to endless meetings where people argue about whose numbers are right instead of making decisions.
Compliance anxiety keeps you up at night. You know you need to protect PHI, PII, and FERPA-protected data, but you’re not confident you know who has access to what. Audit trails are incomplete, and when auditors or regulators come calling, you’re scrambling to pull together documentation.
Slow time to insight frustrates everyone. When leadership asks a question, it takes days or weeks to answer because you’re starting from scratch every time. There’s no self-serve capability, so every request becomes a custom project for your already overwhelmed data team.
Rising costs with unclear value are a growing concern. Your cloud data warehouse bill keeps growing, but you’re not sure what’s driving it. You have dozens of dashboards, but you don’t know which ones people actually use. You’re paying for tools that might be redundant, but no one has time to audit and consolidate.
And AI unreadiness is the newest pressure point. Everyone is talking about AI, and leadership is asking what you’re doing with it, but your data isn’t in a state where you can responsibly train models or deploy AI use cases. You don’t have clean feature tables, you don’t have drift monitoring, and you don’t have secure zones for experimentation.
System-Specific Challenges by Sector for AI Readiness
Finance ↔ Program Data, 311 ↔ Work Orders, Grants ↔ Outcomes
Service routing, program transparency, cost-per-outcome
What Good Looks Like in Practice for AI Readiness
When your stack is right on track, the difference is tangible. In healthcare, your clinical and operational teams have real-time visibility into quality metrics, capacity, and revenue cycle performance. Denied claims are flagged before they’re submitted. High-risk patients are identified early, and care coordinators get next-best-action recommendations directly in their workflow. Your data supports value-based care contracts because you can measure and report outcomes reliably.
In higher education, your enrollment funnel is instrumented end-to-end. Admissions knows which programs and campaigns are driving yield. Advising teams get early alerts when students show signs of disengagement in the LMS. Financial aid and student accounts have a unified view of each student’s journey. Advancement teams can target alumni outreach based on engagement and giving history. And you can forecast enrollment and revenue with confidence because your definitions are consistent and your data is fresh.
In state and local government, your department heads have dashboards that show program performance and cost per outcome. Constituent service requests are routed intelligently based on priority and capacity. Public safety teams can analyze incident patterns to deploy resources more effectively. Capital projects have full spend and timeline transparency. And when it’s time to report to state or federal agencies, the data is already there, tested, and auditable.
Across all three sectors, your data team is focused on strategy instead of firefighting. Self-serve BI means business users can answer their own questions. Governance is built in, not bolted on. Costs are predictable and tied to value. And AI use cases are moving from pilots to production because the foundation is solid.
Where Do You Go From Here for AI Readiness?
If you scored yourself and realized you have lots of work to do, you’re not alone. Most organizations in healthcare, higher ed, and government are still in the early stages of data maturity. The good news is that the path forward is clear, but it requires expertise to navigate the complexity of your systems, compliance requirements, and organizational priorities.
If you’re a little behind, you’ve built the foundation, but now you need to focus on governance, activation, and cost control. That means implementing a semantic layer, enforcing access policies, adding lineage and quality tests, and pushing insights back into the operational tools your teams use every day. This is where data strategy consulting becomes critical to avoid costly missteps.
And if you’re right on track, your focus should be on optimization and innovation. That means tightening cost observability, expanding AI use cases with strong guardrails, and treating data as a product with clear ownership, SLAs, and lifecycle management.
The question isn’t whether your data stack needs to evolve. It’s whether you’re going to take control of that evolution or let it happen to you. If you’re ready to assess where you stand, identify your biggest gaps, and build a roadmap tailored to your systems and priorities, contact our team to get started.
Frequently Asked Questions about Readiness
What’s the quickest path to value for organizations just getting started? Consolidate your core systems into a single source of truth, define your golden metrics with clear ownership, and publish three dashboards everyone trusts. Then layer in governance and activation to operational tools.
How do we avoid tool sprawl and runaway costs? Start with a reference architecture and a metrics catalog. Track usage and cost per query. Sunset underused datasets and dashboards quarterly. Make sure every tool has a clear owner and measurable ROI.
How should we treat sensitive data like PHI, FERPA-protected records, and PII? Classify data at ingestion, enforce role-based access controls with full audit logs, and use de-identified or limited datasets for analytics work. Compliance should be built into your pipelines, not bolted on afterward.
When should we invest in advanced analytics and AI Readiness? After you have reliable pipelines, consistent definitions, and strong access controls in place. Begin with use cases tied directly to revenue, cost savings, or service outcomes. Measure business impact, not just technical performance.
What KPIs prove the stack is working? Reliability metrics like percentage of pipelines on time, adoption metrics like weekly active BI users, time-to-insight for new requests, and outcome metrics specific to your sector like denied claims reduction, enrollment yield lift, or service ticket resolution time.
The fastest news in tech right now is not a new tool. It is the pace of large vendors partnering to bring compute, software, and services together in one place. Oracle is deepening its work with Nvidia. Google is doing the same. These moves change how quickly teams can move from a pilot to production AI Alliances. This article explains what is new, why it matters, and where Arc Analytics fits. For a view of our services, start here: Arc Analytics Services.
What is actually new within the AI Alliances?
Oracle and Nvidia are making Nvidia’s software stack available inside the Oracle Cloud console. Teams can select optimized services, spin up tested recipes, and connect to database features that now support search on vectors. Oracle also signals that the next wave of chips will be available across its regions, with larger clusters and faster links.
Google and Nvidia continue to align on hardware, training frameworks, and content checks. Workloads built with familiar open source tools run more efficiently on Nvidia hardware in Google Cloud. There is also progress on watermarking of generated content to help track sources.
Oracle is also partnering with AMD. This matters because it widens choice and can reduce wait times for capacity. It also encourages teams to design for more than one type of chip from the start.
Why this matters to buyers
These alliances shorten the time between an idea and a live service. You get curated building blocks inside the cloud consoles, tested reference paths, and simpler billing. You also get clearer choices for sensitive workloads, since sovereign and government regions are part of the story. The tradeoff is that capacity planning and cost control matter more than ever. You will want a plan that can move across vendors, across chip families, and across regions without a redesign.
Foundation first
Speed only helps if your basics are solid. Most projects stall because data is scattered, definitions are unclear, and access rules are loose. Before you ride the wave of new services, put the ground in order.
Centralize the highest value domains and automate the refresh.
Write down how core metrics are calculated and publish them.
Set ownership for data quality, access, and change control.
What the AI Alliances can change in the next 6 to 12 months
Procurement moves earlier. Reservation windows and capacity queues will shape timelines.
Architecture needs portability. Design for multiple chip options and containerized runtimes that can shift without code rewrites.
Search moves into the database. Features for vector search inside Oracle Database reduce custom glue code.
Content checks are becoming table stakes. Watermarking and traceability will show up in reviews and audits.
Where each alliance fits
Scenario
Why it helps
What to check
Regulated or sovereign workloads
Oracle with Nvidia offers regions and controls that match strict rules
Residency needs, review cycles, audit trails
Fast pilot to production on Nvidia stack
Recipes and ready services in the Oracle console speed delivery
Latency targets, cost caps, on-call readiness
Open source training and research
Google with Nvidia optimizes common frameworks at scale
Framework fit, training time, data egress
Price and capacity flexibility
Oracle partnering with both Nvidia and AMD widens options
Queue times, chip mix, contract terms
How Arc Analytics turns AI Alliances into outcomes
Platform and workload fit
We compare Oracle Cloud, Google Cloud, and hybrid layouts for your use cases. You receive a reference design, cost model, and a plan for capacity.
Data readiness and modeling
We connect sources, model core tables, set refresh schedules, and prepare search features using vectors when needed. See our Data Services page for the full scope.
Deployment engineering
We stand up containerized services, wire run logs and alerts, and create simple rollbacks. If your reporting layer runs on Qlik, we also connect models to dashboards. See Qlik Services.
Governance and risk
We define roles, access, and change control. We document metric logic, lineage, and review steps. See Data Governance.
Staffing support
When you need extra hands, we provide architects, data engineers, and analysts. See Staffing.
A practical 90-day plan for your own AI Alliances
Phase
Timeline
Key Activities
Value Delivered
Assess and align
Days 0 to 30
Map current systems and data flows. Select one high value use case. Draft target architecture across Oracle, Google, or hybrid.
Stakeholder alignment on priority use case. Reference design with portability. Initial cost model.
Build the core
Days 31 to 60
Centralize core data sets with automated refresh. Publish metric definitions and tests. Reserve capacity and prepare runtime environments.
Live data foundation with passing tests. Published data dictionary. Capacity secured and cluster ready.
Ship and benchmark
Days 61 to 90
Deploy one production workflow with monitoring and rollback. Benchmark cost and performance across two vendor options. Publish access model and governance checklist.
Production use case live with SLOs. Cost per query tracked. Benchmark report across vendors. Governance in place.
What good looks like at day 90
Area
Outcome
Proof
Live workflow
One production use case with support coverage
SLO dashboard and on-call rotation
Data clarity
Shared metric logic and dictionary
Public page with version history
Cost and capacity
Monthly report on cost per query and queue times
Benchmarks across at least two vendor options
Governance
Access roles and change log in place
Review notes and approvals
How the AI Alliances Position You
You gain a clean base, clear definitions, and a small set of live services that prove value. You also gain a design that can shift across vendors without starting over. This reduces risk when prices move or when a region fills. It also prepares you to use new features faster, since your data and models are already in order.
Where Arc Analytics Adds Value
We keep current on vendor moves, so your plan reflects the latest choices from Oracle, Nvidia, Google, and AMD.
We translate news into a design you can run. Our focus is the pipeline, the model logic, the access rules, and the dashboard that the business trusts.
We help you avoid narrow choices that lead to lock in. From the start, we design for portability across chips, regions, and clouds.
If you want a plan that fits your business and takes advantage of these alliances without locking you in, start with a short assessment. You will get a readiness score, a target design, and a cost view you can share with leadership. Contact us at Arc Analytics.
“AI reporting” is everywhere. Vendors promise magic; dashboards claim to be AI‑powered. But most organizations don’t need a science experiment; they need trusted, timely decisions. If your team is still stitching together spreadsheets from ERP, CRM, databases, and exports, AI won’t fix that. It will amplify it.
This post clarifies what AI reporting really is, what it isn’t, and the practical (and profitable) path to get there—without the buzzword bingo.
The Problem With the Hype
Ambiguous promises lead to misaligned expectations and stalled initiatives.
Teams operate in silos and rely on manual refreshes, so no one trusts the numbers.
Leaders buy “AI” before fixing foundations (integration, governance, adoption).
Result: expensive tools, low adoption, and insights that arrive too late to matter.
Why This Matters Now
AI isn’t just another tool category. When done right, it:
Improves decision‑making with explainable drivers and predictive signals.
Reduces cost by automating repetitive reporting work.
Creates competitive advantage by surfacing opportunities and risks earlier.
But without a solid data foundation, AI becomes a megaphone for bad data. The path to value is sequential, not magical.
What “AI Reporting” Actually Means
AI reporting is analytics augmented by machine intelligence to:
Surface anomalies and outliers you’d otherwise miss.
Explain KPI drivers (why something changed and what’s contributing).
Forecast trends with probabilistic confidence ranges.
Recommend next best actions or segments to target.
Answer natural‑language questions (NLQ) against governed data.
Think of AI as an accelerator on good data and sound models, and not a substitute for them.
What It Doesn’t Mean
Replacing strategic thinking or domain context.
Magically fixing messy, incomplete, or siloed data.
Instant ROI without integration, governance, and user enablement.
Fully autonomous decision‑making across the business.
The AI Reporting Maturity Path
Use this to align stakeholders and prioritize investments. It’s a staircase, not a leap.
Infographic concept (for your design team)
A four‑step staircase or pyramid labeled: 1) Spreadsheets & Manual, 2) Automation & Integration, 3) Real‑Time Dashboards, 4) AI‑Driven Insights. Add brief captions under each step (chaos → consistency → visibility → prediction).
Comparison table
Stage
What You Have
Risks If You Stop Here
What Unlocks Next Stage
Spreadsheets/Manual
CSVs, copy/paste, monthly decks
Errors, delays, no single source of truth
Connect ERP/CRM/DBs/APIs; standardize definitions
Automated & Integrated
Scheduled refresh, pipelines, governance
Faster but still reactive
Real‑time dashboards + event‑driven alerts
Real‑Time Dashboards
Live KPIs, alerts, shared access
Limited foresight
Add AI: anomaly detection, forecasting, NLQ
AI‑Driven Insights
Explanations, forecasts, recommendations
Change management/adoption
Training, guardrails, iterate on high‑ROI use cases
Use Cases That Work Right Now with AI Reporting
These are practical, budget‑friendly entry points that prove value in 30–90 days.
Function
AI Assist
Business Impact
Finance
Forecast + variance drivers
Faster, more confident decisions; fewer surprises
Sales/RevOps
Deal and pipeline risk scoring
Higher win rates; better focus on at‑risk deals
Operations
Anomaly detection on throughput/inventory
Lower waste; better service levels and OTIF
Executive
NLQ on governed KPIs + proactive alerts
Faster alignment; fewer status meetings
Prerequisites Most Teams Skip
Before you pilot AI reporting, confirm these boxes are checked:
Data integration across ERP/CRM/databases/APIs to eliminate silos
Data quality, lineage, and access controls so people trust the numbers
Automated refresh, monitoring, and incident alerts to replace manual reporting
Enablement and adoption plans so humans + AI actually work together.
Governance guardrails for responsible AI (auditability, bias, privacy).
In today’s digital-first economy, speed and accuracy define competitiveness. Yet, many businesses still rely on tedious manual reporting — pulling fragmented data from ERP systems, CRMs, spreadsheets, databases, and APIs. This isn’t just inefficient; it’s dangerous for decision-making.
The truth is simple: manual reports no longer belong in the 21st century. Artificial Intelligence, cloud analytics, and automated platforms like Qlik Cloud, paired with Arc Analytics services, remove the friction, reduce risk, and unlock real-time insights that drive growth.
The Problem with Manual Reporting
When reporting depends on cut-and-paste work from multiple silos, organizations face recurring pain points:
Lost Productivity: Employees spend hours creating the same static reports every week.
Human Errors: Simple mistakes in formulas or data consolidation lead to costly missteps.
Outdated Insights: By the time reports are compiled, the data is already old.
Fragmentation: Data scattered across tools (ERP, CRM, Excel) is nearly impossible to consolidate seamlessly.
Here’s a quick comparison:
Factor
Manual Reporting
Automated Reporting (Qlik Cloud)
Time Spent
Hours/days of repetitive work
Instant refresh in real time
Accuracy
High chance of errors
Consistent, AI-enhanced checks
Scalability
Difficult as data grows
Effortless across unlimited sources
Collaboration
Static files emailed around
Live dashboards for all stakeholders
If you’re still relying heavily on Excel fire drills, you’re missing the opportunity to lead with confidence and agility.
Why Automation + Analytics Matter
Manual reports are reactive. Automation shifts analytics to being proactive and predictive. Imagine:
Real-time dashboards updating every time data changes in your system.
AI algorithms highlighting anomalies, trends, and risks before they escalate.
Workflows automated so teams focus on insights, not grunt work.
Predictive recommendations that help leaders make better, faster calls.
Instead of using reports as a rear-view mirror, automated analytics makes them your GPS for decision-making.
Arc Services: Your Partner in AI Reporting
At Arc Analytics, we specialize in creating seamless reporting ecosystems. We don’t just install tools; we transform reporting and analytics into strategic assets.
We work with you to:
Integrate all data sources: from ERP to CRM to Excel spreadsheets, APIs, and legacy systems.
Design real-time dashboards tailored to your KPIs and industry.
Enable adoption: training teams so they can confidently use Qlik Cloud.
Ensure governance and scale: sustainable, secure reporting frameworks that grow with your business.
Our expertise unlocks the full potential of Qlik while tailoring solutions to your unique challenges.
Why Qlik Cloud Changes the Game for Reporting
Qlik Cloud is built for businesses that want to eliminate inefficiencies and embrace modern analytics.
Core Benefits of Qlik Cloud
AI-Powered Insights: Natural-language queries simplify analytics for non-technical users.
In today’s data-driven economy, analytics platforms aren’t just about dashboards — they’re about enabling smarter, faster decisions that fuel real business growth with ROI. Choosing between Qlik Sense (on-premise) and Qlik Cloud (cloud-native) isn’t simply a technical debate — it’s about how your organization can maximize ROI from data.
At Arc Analytics, we help businesses navigate these decisions daily. This guide breaks down the strengths of both Qlik options, showcases where Qlik Cloud creates new opportunities, and explains how a hybrid approach might unlock the best of both worlds.
The Core Difference: On-Premise Control vs. Cloud Agility
Qlik Sense (On-Premise): Best suited for organizations with strict security, compliance, or legacy systems. You retain full control over infrastructure while enjoying Qlik’s powerful associative data engine.
Qlik Cloud (Cloud-Native): A flexible, continuously evolving platform that delivers scalability, accessibility, and advanced analytics. Updates roll out automatically, reducing IT overhead and giving teams instant access to new features.
This core choice — control vs agility — frames today’s analytics strategies.
Why Businesses are Moving to Qlik Cloud
Qlik Cloud isn’t just Qlik Sense in the cloud. It’s a next-generation platform designed to enhance ROI and reduce friction in just about every phase of analytics.
🚨 Proactive Insights with Qlik Alerting
Set real-time, data-driven alerts to act the moment thresholds are crossed or anomalies appear.
📊 Advanced Qlik Reporting Suite
Automated, polished, and customizable reports that ensure insights are delivered to the right people, exactly when they need them.
🔄 Drag-and-Drop Data Flows
Reduce IT bottlenecks with visual data preparation for analysts and business users — no heavy scripting required.
👥 Seamless Collaboration
Enable true real-time co-authoring and dashboard sharing across teams, locations, and devices.
📈 Elastic Scalability
Scale instantly to meet spikes in data volume or user demand. No more waiting on hardware expansions.
🔒 Enterprise-Grade Security
Far from being a risk, Qlik Cloud meets rigorous security standards, often exceeding what smaller enterprise IT setups can provide.
🤖 AI + Machine Learning Insights
Go beyond dashboards with AI-powered predictions and ML-driven insights.
🌍 Broad Data Connectivity
Unify cloud and on-premise sources into one analytics environment.
Unlocking ROI with Automation, Qlik Answers, and Qlik Predict
One of the most transformative ROI drivers in Qlik Cloud is the ability to automate and modernize how users interact with data:
Qlik Automation connects processes, apps, and triggers, removing manual tasks from your team’s workload.
Qlik Answers lets users ask questions in natural language and get instant, contextual insights — expanding analytics adoption to the entire workforce.
Qlik Predict leverages machine learning to forecast trends and give businesses predictive power, not just reactive dashboards.
These SaaS-native tools go far beyond cost savings — they unlock entirely new value streams, driving adoption, speeding decisions, and creating competitive differentiation.
Migrating from Qlik Sense to Qlik Cloud can be daunting without the right expertise. This is where Arc Analytics’ Qlik Migration Services give you a competitive edge.
We specialize in:
Ensuring zero downtime migration.
Rebuilding complex Qlik apps in the cloud for performance gains.
Training teams for success in Qlik Cloud environments.
Notably, Qlik itself recently launched the Qlik Sense to Qlik Cloud Migration Tool (May 2025), giving organizations an official, streamlined path to migrate apps, data connections, and user roles. We combine this tool with our strategic approach for the smoothest possible transition.
Hybrid Approaches: Best of Both Worlds
For many enterprises, the smartest path isn’t choosing one — it’s choosing both.
Keep sensitive workloads in Qlik Sense on-premise for compliance.
Use Qlik Cloud for innovation, new projects, or global accessibility.
Minimize costs with licensing options that allow a hybrid setup at only ~30% additional cost.
This approach unlocks incremental ROI without forcing a “rip-and-replace” investment.
High-Level Licensing & ROI Comparison
Feature/Model
Qlik Sense (On-Premise)
Qlik Cloud (SaaS)
Licensing Model
Core-based (per CPU/core)
Capacity-based (data volume & users)
Infrastructure Costs
Requires hardware, maintenance, IT resources
Included in subscription (no infrastructure overhead)
Scalability
Limited to available cores & hardware
Elastic, scales on-demand
Updates & Upgrades
Manual patching & downtime
Continuous updates built-in
Security & Compliance
Controlled on-prem, internal governance
Enterprise-grade, built-in compliance frameworks
Total Cost of Ownership
High upfront + ongoing infra costs
Predictable subscription, pay for usage
ROI Focus
Infrastructure investment heavy
Data-driven outcomes & business agility
Takeaway: With Qlik Sense, ROI is partly consumed by infrastructure cost and IT overhead. With Qlik Cloud, that same investment is redirected toward automation, innovation, and user adoption — where business ROI is truly measured.
The ROI Equation
Migrating to Qlik Cloud doesn’t replace your past Qlik investment — it amplifies it. By combining proactive alerts, advanced reporting, Qlik Automation workflows, Qlik Answers for natural language analysis, and Qlik Predict for machine learning insights, companies can:
Improve decision-making speed.
Reduce IT overhead and manual reporting.
Empower every department with data-driven culture.
Stay future-ready as Qlik continues innovating.
Ready to Maximize Your Qlik ROI?
Whether full migration or hybrid, Arc Analytics is your partner in unlocking more value from Qlik.
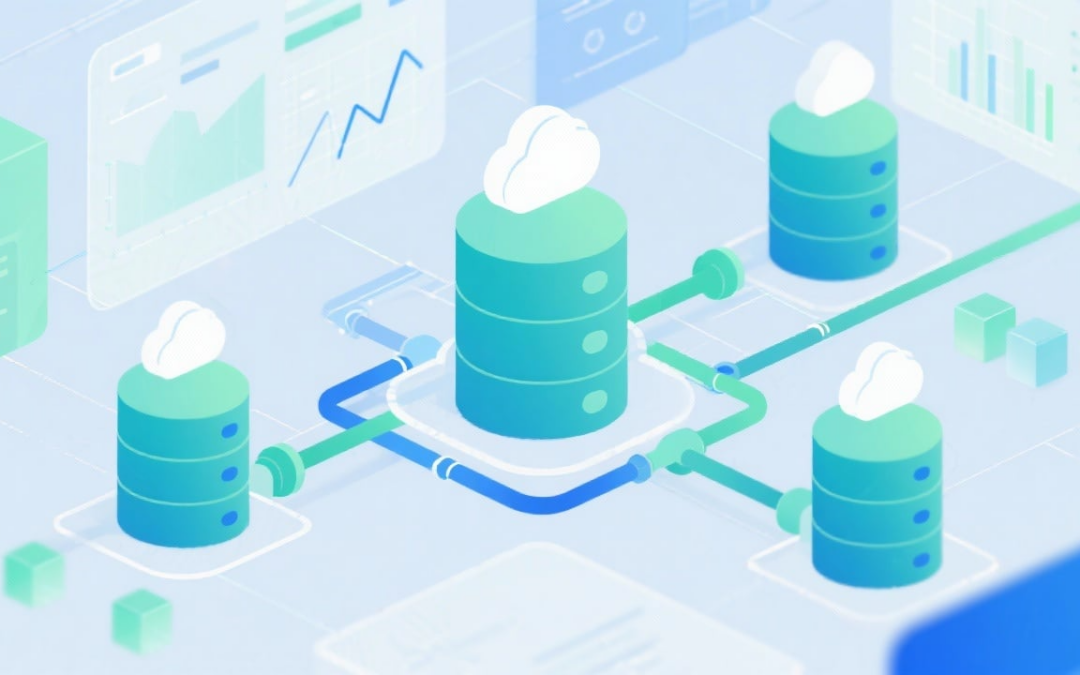
For IT leaders and cloud architects, scalability isn’t just about adding storage or compute—it’s about designing a data infastrucutre that can sustain velocity, variety, and volume without sacrificing performance, governance, or cost efficiency.
Most infrastructures that work in early stages eventually break under pressure: query latency spikes, pipelines slow, storage thresholds force hard data-retention decisions, and new integrations become brittle. This isn’t just an operational headache—it’s a systemic limitation that compromises data reliability and agility across the enterprise.
At Qlik, we see this every day: organizations that proactively design for scalability achieve not only data resilience, but the ability to expand analytics, machine learning, and real-time decisioning at enterprise scale.
Why Non-Scalable Data Architectures Fail
When data infrastructure isn’t built for scale, challenges multiply quickly:
Throughput bottlenecks – ETL jobs that run overnight now take days.
Data silos – Multiple ungoverned storage layers prevent reliable analytics.
Cost inefficiency – Ad hoc scaling without automation results in overspend.
Poor resiliency – Systems that stall or fail under peak workloads reduce trust in data.
For IT directors, the real cost here is not just performance degradation—it’s losing the ability
Core Principles for Scalable Enterprise Data Infrastructure
Technical leaders can insulate against these risks by designing around five fundamentals:
Elastic Compute + Storage – Native autoscaling for ingestion, transformation, and warehousing.
Decoupled Services – Avoid monoliths. Architect for loose coupling across ingestion, processing, storage, and analytics.
Pipeline Automation – Continuous integration and deployment (CI/CD) for analytics pipelines reduces manual operations while supporting rapid iteration.
Observability & Monitoring – Real-time metrics, lineage, and anomaly detection to pre-empt bottlenecks.
Economic Scalability – Design for TCO (total cost of ownership), not just uptime. Plan for the frameworks to evaluate trade-offs across providers.
👉 Arc Professional Services often helps organizations operationalize these principles through reference architectures, deployment accelerators, and governance frameworks across cloud and hybrid data ecosystems.
Reference Architectural Patterns
The building blocks of scalable infrastructure vary, but certain patterns consistently deliver at enterprise scale:
Cloud-Native Architectures – Managed elastic compute/storage (AWS, Azure, GCP) tailored via policies for autoscaling and failover. See our guide on Building a Cloud Data Strategy to align platform selection with scalability goals.
Distributed Systems – Leverage Spark/Dask for distributed compute, Kafka for real-time messaging, and distributed query engines (Presto, Trino) for federated analytics.
Microservices & APIs – Isolate high-throughput services (fraud detection, personalization) into independently scalable units; deploy via containers and Kubernetes orchestration.
Hybrid and Multi-Cloud Mesh – Where latency, regulatory, or locality requirements exist, Qlik’s integration solutions bridge on-premises and cloud-native stores into a cohesive fabric with data lineage and governance.
Technology Decisions That Drive Data Infrastructure at Scale
For IT decision makers, selecting the right scaling tools requires weighing trade-offs:
Storage – Object stores (S3, Blob, GCS) for scale-out economics; NoSQL DBs (Cassandra, MongoDB) for flexible schema and horizontal reads/writes; columnar/cloud warehouses (Snowflake, BigQuery, Redshift) for analytics concurrency.
Compute & Processing – Batch and micro-batch with Spark/Dask; streaming with Kafka + Flink; consider Kubernetes orchestration for elastic container scaling.
Data Movement & Integration – Use CDC (change data capture)–enabled pipelines for real-time data replication. This is where Qlik excels—providing low-latency ingestion with lineage and CDC at scale.
Visibility & Governance – Implement observability into every layer; Qlik solutions embed lineage and metadata management to avoid “black box” integrations.
📌 As Gartner notes in their Data Management Maturity Model, scalability isn’t just technology—it requires aligned governance, processes, and integration across the data lifecycle.
Scaling Strategies for IT Leaders
Scaling should be iterative and framed as a roadmap, not a single migration project. Consider these strategies:
Foundational First – Build around elastic storage/compute before layering complex processing systems.
Automation Everywhere – Autoscaling, IaC (Infrastructure as Code), CI/CD pipelines for ingestion and analytics.
Observability-Driven – Keep real-time monitoring/alerting across ingestion, storage throughput, query latency, and pipeline success rates.
Plan by Workload Models – Model current/future concurrency + workload shapes, not just raw data volume.
Continual Optimization Loop – Regular audits for both performance and cost.
🔧 Qlik’s Professional Services partner with IT leaders to design and operationalize scaling strategies—from elastic CDC pipelines to governed multi-cloud architectures. Our team ensures scalability paths are not only designed but also implemented with integration best practices.
Technical Scalability as a Business Enabler
For IT directors and cloud architects, scalable data infrastructure isn’t about keeping the lights on—it’s about enabling the organization to innovate, move fast, and trust its data under continuous growth.
By following proven architectural principles, choosing technologies designed for horizontal scale, and embedding governance + observability into every layer, you ensure that infrastructure doesn’t become tomorrow’s bottleneck.
With Qlik’s platform and services, enterprises can bridge cloud-native, hybrid, and distributed systems into a single governed fabric—delivering elastic scalability with integration and lineage built in.
That’s the difference between scaling infrastructure and scaling real business impact
Arc Analytics is a full-service data analytics and integration consultancy based in Charlotte, NC, USA, specializing in the Qlik platform. Browse the posts below for practical Qlik tips, migration guidance, and real-world use cases from our consulting work.