In today’s data-driven economy, businesses depend on skilled professionals to turn raw information into actionable insights. Two of the most critical roles are the data engineer and the data scientist. While these titles are often mentioned together, their responsibilities, skills, and day-to-day work differ significantly.
If you’re considering a career path — or trying to hire the right talent — understanding the difference between a data engineer vs. data scientist is essential.
What Does a Data Engineer Do?
Data engineers are the architects and builders of an organization’s data infrastructure. They design, construct, and maintain the pipelines, databases, and platforms that make clean, reliable data available for analytics and business intelligence.
Core Responsibilities of Data Engineers
Designing and maintaining data pipelines (ETL/ELT processes)
Building and managing data warehouses and data lakes
Ensuring data quality, consistency, and scalability
Implementing security measures to protect sensitive information
Optimizing data systems for performance, cost, and efficiency
Key Skills for Data Engineers
Strong programming in Python, SQL, and Scala
Expertise in databases (SQL & NoSQL)
Familiarity with cloud platforms (AWS, Azure, GCP)
👉 Explore more on how we help clients build scalable infrastructures in ourData Engineering Services page.
What Does a Data Scientist Do?
While engineers prepare the data, data scientists dive into it to uncover insights, predict outcomes, and inform decision-making. They apply statistics, machine learning, and AI to transform raw datasets into actionable intelligence.
Core Responsibilities of Data Scientists
Cleaning, exploring, and preparing data for modeling
Applying statistical analysis and machine learning algorithms
Building predictive and classification models
Visualizing complex results for technical and business audiences
Framing business problems as solvable data questions
Key Skills for Data Scientists
Strong background in math, statistics, and machine learning
Programming with Python, R, or Julia
Proficiency in visualization tools: Tableau, Power BI
Experience with ML libraries (scikit-learn, TensorFlow, PyTorch)
Ability to communicate business-ready recommendations
While different, these roles are deeply interconnected. Data engineers ensure high-quality foundations; data scientists transform that foundation into insights.
Which Career Path Is Right for You?
If you’re debating between becoming a data engineer or a data scientist, consider:
Do you enjoy building systems, solving infrastructure problems, and optimizing performance? → Data Engineering may be your fit.
Do you prefer analyzing data, applying models, and storytelling with insights? → Data Science might be your direction.
Both paths are in high demand and offer strong growth opportunities. For organizations, the best results come when both roles collaborate closely.
(Curious how we guide talent strategy? Read ourData Careers Guide for insights.)
What Comes First: Data Engineer or Data Science?
The reality is — data engineering usually comes first. Without well-structured, accessible data, even the most advanced science and modeling will fail.
Think of it like constructing a building: you wouldn’t hire interior designers before architects and builders lay a solid foundation. Similarly, no data science project succeeds without a trusted, scalable infrastructure in place.
👉 This is why many companies start by investing inModern Data Infrastructure before scaling analytics initiatives.
Future of Data Roles
Both roles are evolving with emerging technologies:
Data Engineers: Focus on cloud-native architectures, data governance, and security
Data Scientists: Sharpen expertise in deep learning, natural language processing (NLP), and explainable AI
Automation tools are accelerating workflows, but the demand for human expertise in designing systems and interpreting results will only grow.
Organizations that foster close collaboration between these two functions will be best positioned to leverage AI and data for competitive advantage.
For more perspectives on where business data is heading, check out our recent post onThe Future of AI in Business.
Forward Thinking
The distinction between data engineers and data scientists isn’t about competition — it’s about collaboration. Together, they form the backbone of any modern data team.
Businesses that want to succeed in the data economy must invest in both infrastructure (engineering) and analytics (science). For individuals, both career paths offer rewarding opportunities to shape the future of how organizations harness information.
Frequently Asked Questions (FAQ)
Is data engineering harder than data science?
Not necessarily. Data engineering leans heavily on programming, system design, and cloud infrastructure, while data science requires a deep understanding of math, statistics, and modeling. The difficulty depends on your background and interests.
Who earns more: Data engineer or data scientist?
Salaries vary by industry and experience, but historically data scientists earn slightly higher median salaries due to their specialization in machine learning and AI. However, demand for data engineers is rising quickly as companies recognize the importance of solid infrastructure.
Do you need data engineering before data science?
Yes. Without a reliable and scalable data infrastructure, data scientists cannot work effectively. That’s why many organizations invest in data engineering first, then scale into analytics and advanced modeling.
Which career path should I choose?
If you enjoy building systems, working with databases, and solving infrastructure problems, pursue data engineering. If you’re more interested in analytics, machine learning, and storytelling with data, consider data science. Both fields are in high demand.
Are data engineers and data scientists replacing each other?
No — these are complementary roles. Data engineers build the foundation, while data scientists analyze and interpret the data. Together, they drive data-driven decision-making.
Schools and universities run on many systems—SIS, LMS, assessments, finance, alumni, and clinical programs. Without data integration, insight stays trapped, reports conflict, and decisions slow down. With the right data integration plan, these systems tell one story about students, programs, and resources.
Different definitions for attendance, course completion, or program status lead to “dueling dashboards.” Establishing common definitions, validation rules, and routine data quality checks aligns reports across campuses and terms. Governance gives everyone confidence in what the data means.
• Shared definitions and validation rules end report drift
• Routine quality checks catch errors before they spread
• Data lineage explains where numbers come from
3. Slow Financial Visibility
Funding, grants, tuition, purchasing, and budgeting often sit in separate systems, making reconciliation slow.
• Connect accounting, grants, procurement, and planning for one finance model
• Tie spend to objectives and refresh KPIs quickly
• Streamline audits with consistent structures and controls
Student, parent, faculty, and alumni surveys hold valuable signals, but mixed tools and formats make comparisons hard. Standardize surveys and join responses to SIS/LMS data. Suddenly, a shift in satisfaction aligns with schedule changes, program redesigns, or resource gaps, and action is clearer.
• Standardize instruments so results compare term to term
• Join surveys to SIS/LMS data to see cause and effect
• Track changes over time to inform program design
5. Clinical Programs Kept Apart
Nursing, medicine, and allied health track EHRs, clinic software, and simulation data separately from academics. Secure connectors merge clinical hours, competencies, and outcomes with the academic record. Education data integration shortens accreditation reporting and gives faculty a complete picture of progress.
• Secure connectors sync clinical hours, competencies, and outcomes
• Unified records show skills, progress, and accreditation evidence
• Faculty gain a complete view of each learner
6. Manual Work and Spreadsheet Stitching
Exports, copy‑paste, and one‑off scripts drain time and add risk. The payoff is faster cycles and fewer late-night fixes.
• Managed pipelines to replace ad hoc work
• Change data capture keeps apps current where freshness matters
• Documented schedules and runbooks reduce midnight fixes
7. Security and Governance Gaps
As systems connect, risks rise. Define stewards, publish data dictionaries, and track lineage from source to dashboard. Encrypt sensitive data, enforce least‑privilege access, and audit regularly. With governance embedded, integration becomes safe and repeatable rather than fragile.
• Assign stewards and publish a data dictionary
• Encrypt sensitive fields and enforce least‑privilege access
• Audit regularly; track lineage from source to dashboard
8. Choosing an Approach to Data Integration
Match patterns to needs rather than forcing a one‑size‑fits‑all solution.
ETL to Warehouse
Curated reporting, historical trends
Clean, conformed data
CDC/Event Streams
Operational syncs, near real-time
Low-latency updates
Data Virtualization
Fast access across sources
Minimal data movement
• Pilot a narrow use case, prove value, then scale
• Balance freshness, complexity, and cost
• Reuse standards and components across projects
How to Get Started with Data Integration
Map today’s flows, agree on shared definitions, and pick one high‑value pilot—unify SIS and LMS for early alerts, or connect finance for grant tracking. Build with maintainability in mind, train the team, and expand to the next priority. When you’re ready, we’re here to help.
Most businesses run on three core systems: ERP for operations, CRM for customers, and BI for insights. Without ERP, CRM, and BI Data Integration, data gets trapped in silos and critical context is lost. Effective data integration connects these systems so information flows in real time, reducing manual work and errors. When your tools share a single source of truth, teams make faster, smarter decisions and deliver a smoother customer experience. This is how you turn disconnected activity into coordinated growth.
Picture this: Your sales team closes a big deal in the CRM, but your warehouse doesn’t know about it until someone manually updates the ERP. Meanwhile, your BI dashboard shows last week’s numbers because it can’t pull real-time data from either system.
Sound familiar? Here’s what data silos are costing you:
• Duplicate work and manual data entry
• Inconsistent reports across departments
• Delayed decisions based on outdated information
• Frustrated teams working with incomplete data
• Missed opportunities to serve customers better
This fragmented approach doesn’t just waste time—it actively hurts your ability to compete and grow.
Operational Excellence: When Data Integration Works Together
Imagine a different scenario. A customer places an order through your sales team, and instantly:
• Inventory levels update automatically in your ERP
• Production schedules adjust if needed
• Shipping timelines appear in real-time
• Customer service gets full order visibility
• Finance sees revenue impact immediately
This isn’t wishful thinking—it’s what happens when your systems are properly integrated. The result? Smoother operations, fewer errors, and teams that can focus on strategy instead of data entry.
When your CRM and ERP share data, something powerful happens—you see the complete customer story:
CRM Data
ERP Data
Combined Insight
Sales interactions
Order history
Customer buying patterns
Marketing campaigns
Shipping details
Campaign effectiveness
Service tickets
Payment history
Customer satisfaction drivers
Lead sources
Product preferences
Best acquisition channels
This unified view lets your team:
• Personalize every customer interaction
• Predict what customers need before they ask
• Identify upselling and cross-selling opportunities
• Resolve issues faster with complete context
Strategic Decisions: BI That Actually Works
Your BI tools are only as good as the data they can access. When connected to integrated ERP and CRM data, your dashboards transform from pretty charts into strategic weapons:
• Track real-time KPIs across all departments
• Spot trends before your competitors do
• Measure the true impact of marketing campaigns
• Understand which customers drive the most profit
• Make decisions based on complete, accurate data
For example, integrated data might reveal that customers acquired through social media campaigns have 40% higher lifetime value—but only if they purchase within their first 30 days. That’s the kind of insight that drives real business growth.
Making Data Integration Happen
Getting your systems to work together doesn’t have to be overwhelming. Here’s how successful organizations approach it:
Assessment & Planning
Start by mapping your current data flows and identifying the biggest pain points. Where are teams spending the most time on manual work? Which decisions are delayed by missing data?
Choose Your Integration Approach
Native integrations: Use built-in connections when available
Middleware solutions: Deploy integration platforms for complex scenarios
Modern data platforms: Leverage cloud-based tools for scalability
Focus on Business Value
Don’t integrate everything at once. Start with the connections that will have the biggest impact on your operations, customer experience, or decision-making.
Need help getting started? Contact our team to discuss your integration strategy.
The Bottom Line for Data Integration
Breaking down data silos isn’t just about technology—it’s about unlocking your organization’s potential. When your ERP, CRM, and BI tools work together, you get:
Faster operations with automated data flows
Happier customers through personalized experiences
Smarter decisions based on complete information
Competitive advantage through data-driven insights
The question isn’t whether you can afford to integrate your systems—it’s whether you can afford not to. Start your integration journey today and discover what your data can really do.
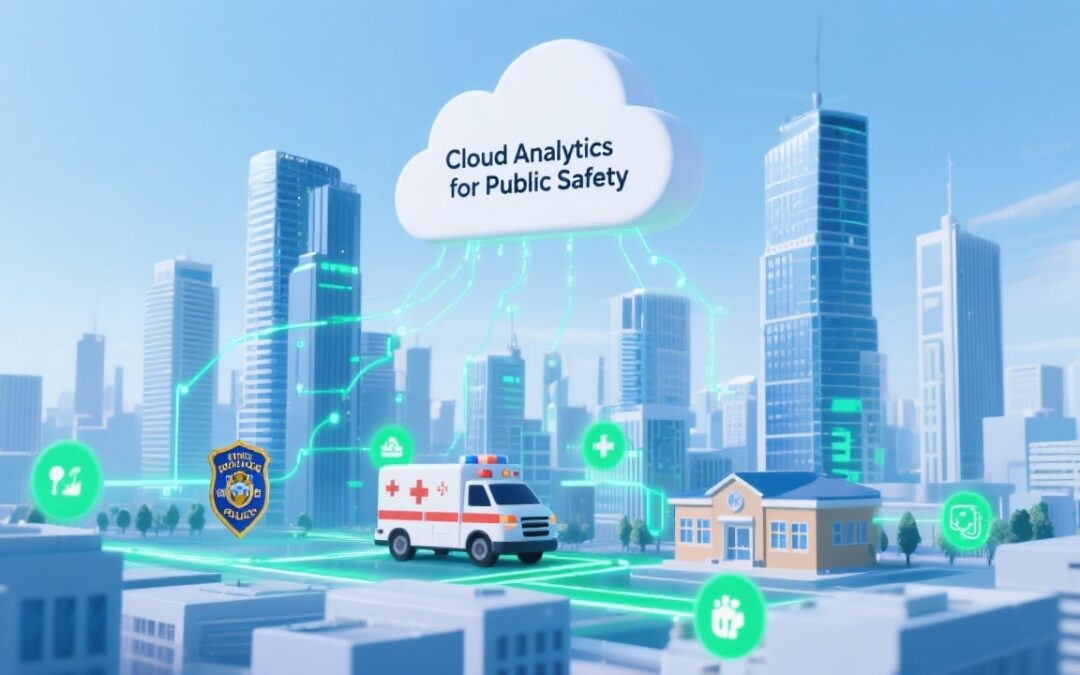
In the complex and critical realm of public safety, timely and insightful data is the bedrock of effective decision-making. From anticipating potential threats to optimizing emergency responses, the ability to rapidly analyze vast amounts of information can quite literally save lives and improve community well-being. This is where Qlik Cloud Analytics steps in, transforming raw data into actionable intelligence that empowers school systems, law enforcement, emergency services, and community leaders.
At Arc Analytics, we’ve seen firsthand how integrating diverse data sets within Qlik Cloud can create a truly powerful picture of public safety dynamics. To illustrate this, we’ve created a unique demonstration that weaves together seemingly disparate data points, providing an unprecedented level of insight into community safety.
Unveiling Insights: A Multi-Layered Look at Community Safety
This demonstration uses Qlik Cloud to visualize complex public safety scenarios, combining publicly available data from across Florida. Almost every layer of data shown is publicly available, but it also contains critical information for understanding safety concerns. These datasets include:
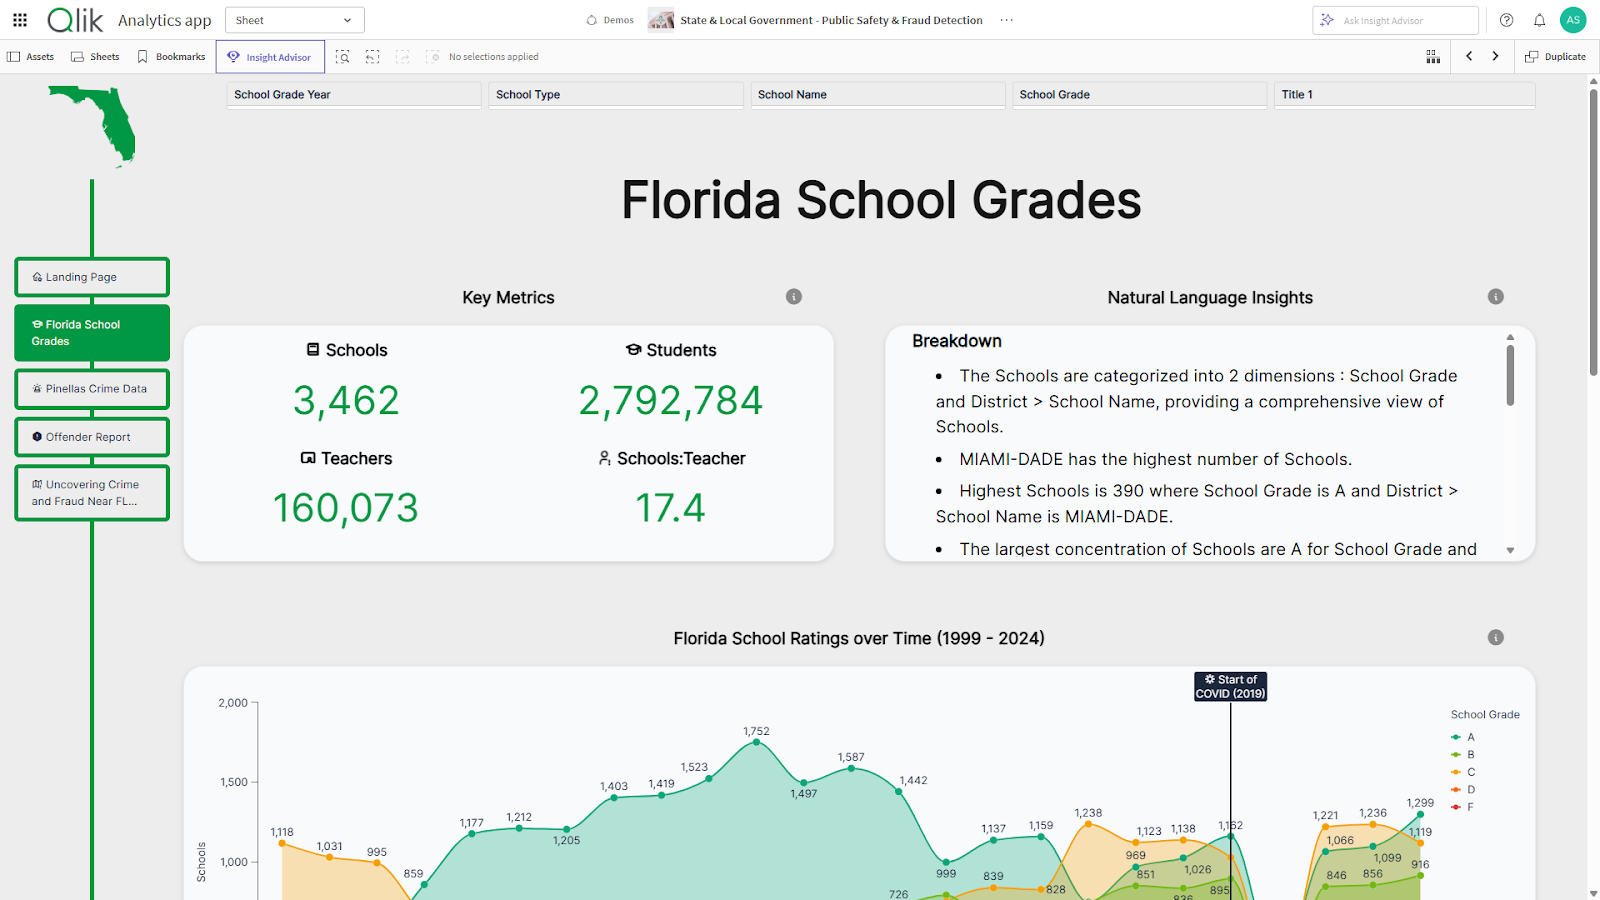
Florida School Grading System (1999-2023): One layer presents the entire state of Florida’s public school grading system from 1999 to 2023. You can see the grades and precise locations of schools across the state, allowing you to gauge educational performance visually.
Pinellas County Crime Data (Last 10 Years): Superimposed on this, another layer displays Pinellas County crime data for the last decade. This isn’t just dots on a map; it’s a dynamic heat map that visually represents the severity of crime, indicating when and where incidents occurred. This gives a visceral sense of criminal activity patterns.
Pinellas County Sex Offender Locations: Perhaps one of the most impactful layers shows the locations of all registered sex offenders in Pinellas County. What makes this particularly compelling is the interactive element: when you hover your cursor over an offender’s location, their mugshot instantly appears.
Pinellas County Bus Routes: A crucial layer reveals the bus routes of Pinellas County. By toggling this on, you can see the lines on the map, allowing for a visual correlation between public transportation arteries and areas with higher crime rates. This insight can be vital for understanding movement patterns and potential vulnerabilities.
Pinellas County SNAP Locations:An open data source that shows each eligible location in Florida that accepts SNAP benefits for the program recipient.
The Critical Role of Monitoring Public School Education in Community Safety
Tracking the educational performance of public schools is vital for understanding community well-being and long-term public safety. By monitoring school grades and trends, stakeholders can identify areas needing support, allocate resources more effectively, and address underlying issues that may impact youth outcomes. Data-driven insights into education not only help improve academic achievement but also contribute to safer, more resilient communities by empowering early intervention and informed decision-making.
Public safety agencies often face the challenge of deploying limited resources to cover vast and dynamic areas. Qlik Cloud provides the analytical horsepower to make these critical decisions with precision:
Dynamic Deployment Strategies: By integrating crime data, population density, historical incident reports, and even real-time events, Qlik Cloud allows commanders to visualize hotspots and allocate police patrols, fire services, or emergency medical teams more effectively.
Staffing Optimization: Analyzing call volumes, response times, and incident types helps agencies determine optimal staffing levels and shift schedules, ensuring adequate coverage where and when it’s most needed.
Infrastructure Planning: Understanding the correlation between infrastructure (like bus routes, as seen in the demo) and incident patterns can inform decisions about where to increase surveillance, improve lighting, or adjust public transport schedules to enhance safety.
Pattern Recognition: The ability to layer data like school locations, crime hotspots, and known offender residences helps identify subtle patterns that might indicate elevated risks in certain areas or times. This allows for targeted community engagement or increased presence.
Intervention Program Effectiveness: By tracking the locations and characteristics of crime, agencies can evaluate the effectiveness of community programs, youth outreach, or neighborhood watch initiatives. Qlik can show if interventions in specific areas are truly leading to a reduction in incidents.
Risk Area Identification: The demo’s ability to show sex offender locations relative to schools and homes is a prime example of how Qlik can highlight vulnerable areas, allowing for informed alerts to school officials, parents, and community members.
Overview of crime data within Pinellas County
Enhancing Emergency Response and Coordination
In emergencies, every second counts. Qlik Cloud facilitates faster, more informed responses:
Real-time Situational Awareness: By integrating live feeds from sensors, traffic cameras, and dispatch systems, Qlik Cloud can provide first responders with real-time dashboards showing the evolving situation, allowing for quicker decisions on routes, hazards, and necessary resources.
Incident Command Support: During large-scale emergencies, Qlik applications can consolidate information from multiple agencies (police, fire, medical, public works) into a single, intuitive view, enhancing coordination and resource deployment.
Post-Incident Analysis: After an event, Qlik Cloud allows for thorough analysis of response times, resource utilization, and outcomes, providing invaluable lessons for future emergency planning and training.
This powerful mapping tool allows users to toggle each layer on and off, revealing a dynamic narrative of public safety. For instance, a school district official or a concerned parent can easily visualize the proximity of a registered sex offender to their nearest school or even their home location. This immediate, visual insight provides a critical understanding of potential risks that text-based reports simply cannot convey.
The real underlying point of this demo, even though it utilizes publicly sourced data to paint a vivid picture, is this: by providing more and more data sources with deeper aspects of knowledge, you can enable better decision-making no matter your position, role, or concern for public safety. It’s about empowering everyone with the insights they need.
Geometry lines of 20-minute walking distance to school, sex offenders (with mugshot), and SNAP Benefit in downtown St Petersburg
The Power of Data Collaboration for a Safer Tomorrow
The true strength of Qlik Cloud in public safety lies not just in its individual analytical capabilities but in its ability to foster data collaboration. Public safety is rarely the responsibility of a single entity. It involves complex interactions between law enforcement, fire departments, emergency medical services, local government, schools, and community organizations.
Qlik Cloud provides a unified, secure platform where these diverse stakeholders can share, visualize, and collaborate on critical data. This breaks down traditional information silos, enabling:
Cross-Agency Insights: Police departments can share crime trends with school districts, allowing for joint safety initiatives. Emergency services can share incident data with urban planners to identify areas needing better infrastructure.
Informed Community Engagement: By making relevant, aggregated data accessible to the public, as demonstrated by the school performance aspects of this demonstration, it fosters greater community trust and encourages informed citizen participation in safety efforts.
Proactive Policy Making: Legislators and city planners can use these comprehensive datasets to inform policy decisions, allocate budgets, and design safer communities based on clear evidence rather than assumptions.
Partnering for Public Safety with Arc Analytics
At Arc Analytics, we are dedicated to helping public safety agencies and communities harness the full potential of Qlik Cloud. This example is just one powerful, actionable insight that can be gleaned when data is integrated and visualized effectively. We understand the sensitive nature of public safety data and ensure that our solutions adhere to the highest standards of security and compliance.
We work closely with organizations to:
Integrate Disparate Data Sources: Bringing together information from police records, school systems, public transportation, and other critical databases.
Develop Custom Analytical Applications: Building tailored Qlik solutions that address your specific public safety challenges and objectives.
Provide Expert Implementation and Training: Ensuring your teams are proficient in using Qlik Cloud to drive continuous improvements in public safety.
By transforming raw data into clear, actionable intelligence, Qlik Cloud Analytics, supported by Arc Analytics’ expertise, empowers public safety professionals and concerned citizens alike to make better decisions, protect communities, and build a safer future for everyone.
Ready to see the power of Qlik Cloud Analytics in action? Schedule a full demo with our team today and discover how data-driven insights can transform public safety in your community.
In today’s fiercely competitive business landscape, data has moved beyond the realm of simple record-keeping to become the very engine of strategic advantage. Organizations that can effectively harness the insights hidden within their data streams are demonstrably more agile, innovative, and ultimately, more successful. However, the journey towards becoming a truly data-driven organization is not merely about deploying sophisticated analytics platforms. It requires a fundamental shift in culture, a deep-seated commitment that permeates every level of the organization, from the executive suite to individual contributors. This comprehensive guide will navigate the essential steps involved in cultivating a robust data-driven culture, underscoring its profound benefits and illuminating the critical role of people, processes, and technology in this transformative endeavor.
Laying the Foundation: Identifying Key Pain Points and Opportunities
The initial and foundational stage in building a data-driven culture involves a collaborative and thorough effort to pinpoint the specific areas within the organization where data can exert the most significant positive influence. This process extends beyond simply identifying obvious operational bottlenecks or areas of inefficiency. It necessitates engaging stakeholders from across all departments – sales, marketing, operations, finance, customer service, and beyond – to understand their unique challenges and the questions they struggle to answer with existing information. For instance, the marketing team might grapple with understanding which campaigns yield the highest return on investment, while the sales team might lack clarity on the characteristics of their most successful leads. Operations could be struggling with unpredictable supply chain disruptions, and customer service might be reactive rather than proactively addressing potential issues.
Furthermore, the focus should not solely be on rectifying problems. A truly data-driven mindset actively seeks opportunities where data can fuel innovation, enhance the customer experience in meaningful ways through personalization, optimize the allocation of resources across various initiatives, and even identify entirely new business models. By involving a diverse range of perspectives, organizations can uncover a broader spectrum of both pain points ripe for data-driven solutions and untapped opportunities waiting to be unlocked. Prioritizing these identified areas based on their potential impact on key business objectives and the practical feasibility of implementing data-driven solutions will ensure that initial efforts are strategically aligned and deliver tangible value, fostering early buy-in and demonstrating the power of a data-centric approach.
Empowering Solutions: Leveraging Data to Solve Problems and Drive Innovation
Once the key pain points and promising opportunities have been identified, the next crucial step involves strategically applying various methodologies of data analysis to extract meaningful insights and drive tangible improvements. This encompasses a spectrum of analytical techniques, each suited to answering different types of questions. Descriptive analysis provides a historical overview of what has occurred, offering valuable context. Diagnostic analysis delves deeper, seeking to understand the underlying reasons and correlations behind observed trends. Predictive analysis leverages historical data and statistical modeling to forecast future outcomes and anticipate potential challenges or opportunities. Finally, prescriptive analysis goes beyond prediction by recommending specific actions and interventions to achieve desired results.
For example, if a sales team is struggling with high customer churn, diagnostic analysis might reveal specific customer segments or interaction patterns that are strong indicators of attrition. Predictive modeling could then forecast which current customers are most likely to churn, allowing for proactive intervention. Prescriptive analytics could even recommend targeted strategies, such as personalized offers or enhanced support, to mitigate this risk. Similarly, in product development, analyzing customer feedback data (both structured and unstructured) can provide invaluable insights into unmet needs, guiding the creation of innovative new features or products. The process of leveraging data for problem-solving and innovation is iterative, requiring a willingness to formulate hypotheses, rigorously test them against available data, and refine analytical approaches based on the evidence uncovered. Embracing a culture of experimentation, including A/B testing different data-driven strategies, is essential for validating their effectiveness and fostering a continuous cycle of improvement and learning.
Cultivating Data Fluency: The Cornerstone of a Data-Driven Culture
The successful and sustainable embedding of a data-driven culture within an organization fundamentally relies on cultivating a high degree of data fluency across all levels of its workforce. This does not imply that every employee needs to become a data scientist or possess advanced statistical expertise. Instead, it signifies fostering a widespread comfort level in working with data, enabling individuals to understand basic data concepts, interpret visualizations, formulate relevant questions based on data, and confidently utilize data-backed insights in their daily decision-making processes. The specific levels of data literacy required will naturally vary depending on individual roles and responsibilities. However, a foundational understanding of data privacy, ethical data usage, and the ability to critically evaluate data sources are essential for everyone.
Organizations can adopt a multi-pronged approach to elevate data literacy. This includes implementing comprehensive training programs tailored to different skill levels and roles, creating easily accessible internal resources such as data glossaries, style guides for data interpretation, and case studies showcasing successful data application. Mentorship programs that pair data experts with colleagues seeking to enhance their skills can also be highly effective. A critical element is ensuring that data is presented in an accessible and understandable manner for non-technical users, often through user-friendly dashboards and intuitive data visualization tools that abstract away unnecessary complexity. Leadership plays a pivotal role in championing data literacy initiatives by actively demonstrating the value of data in their own decision-making processes, visibly supporting training efforts, and fostering an environment where asking data-related questions is not only encouraged but expected. Ultimately, nurturing a culture of intellectual curiosity, where employees are empowered to explore data and seek evidence-based answers, will solidify data fluency as a core organizational competency and drive widespread adoption of data-driven practices.
Equipping Your Team: Choosing and Implementing the Right Data Tools
The strategic selection and effective implementation of appropriate data tools are critical enablers of a data-driven culture. The right tools can democratize access to data, empower users to perform their own analyses, and streamline the process of generating insights. When evaluating potential data tools and platforms, organizations should consider several key criteria. Usability for a diverse range of users, regardless of their technical proficiency, is paramount. Seamless integration capabilities with existing systems and data sources are essential to break down silos and ensure data accessibility. Scalability to handle growing data volumes and evolving analytical needs is crucial for long-term viability. Robust security features are non-negotiable to protect sensitive data and ensure compliance with relevant regulations. Finally, the overall cost-effectiveness of the tools, considering both initial investment and ongoing maintenance, must be carefully evaluated.
Platforms like Qlik Cloud offer a powerful and versatile suite of capabilities designed to foster a data-driven environment. Their intuitive and interactive data visualization tools empower users to create insightful dashboards and reports with minimal technical expertise, while their robust data integration features facilitate the connection and harmonization of data from disparate sources. Features such as collaborative analytics enable teams to work together on data exploration and insight generation, and embedded analytics capabilities allow for the seamless integration of data insights into existing applications and workflows. However, simply selecting the right tools is only part of the equation. Successful adoption necessitates a well-planned implementation strategy, comprehensive training programs to ensure users can effectively leverage the tools’ features, and ongoing support to address any technical challenges or user questions. Furthermore, establishing clear data governance policies and procedures is essential to ensure the quality, accuracy, and trustworthiness of the data being utilized within these tools, fostering confidence and driving adoption.
Conclusion: Embracing Data as the Engine of Success
In conclusion, the journey towards building a truly robust and impactful data-driven culture requires a holistic and sustained effort that encompasses people, processes, and technology. By systematically identifying key pain points and opportunities, empowering data-driven solutions, cultivating widespread data fluency across the organization, strategically selecting and implementing the right data tools, and diligently sustaining the momentum through continuous learning and leadership commitment, organizations can transform data from a latent asset into the very engine of their success, driving innovation, enhancing efficiency, fostering deeper customer understanding, and ultimately achieving a significant and sustainable competitive advantage in today’s data-rich world.
About Blog
Arc Analytics is a full-service data analytics and integration consultancy based in Charlotte, NC, USA, specializing in the Qlik platform. Browse the posts below for practical Qlik tips, migration guidance, and real-world use cases from our consulting work.