Government shutdowns create immediate operational challenges that ripple through every department. When staff are furloughed and budgets freeze, the work doesn’t stop. HR still needs to process payroll. Finance teams must track spending. Logistics departments have to manage contracts and inventory. The question isn’t whether these functions matter during a shutdown. The question is how agencies can maintain them with fewer people and limited resources. The answer lies in data automation platforms that reduce manual work, maintain data quality, and speed up recovery when normal operations resume.
The Real Cost of Manual Data Processes
Most government agencies still rely heavily on manual data entry, spreadsheet management, and person-dependent workflows. These systems work fine when everyone is at their desk. During a shutdown, they fall apart quickly.
Consider what happens in a typical HR department. Employee records need updating. Benefits require processing. Time and attendance data must be collected and verified. When half the team is furloughed, these tasks pile up. The backlog grows every day. When staff return, they face weeks of catch-up work before operations normalize.
Finance departments experience similar problems. Budget tracking stops. Invoice processing slows. Financial reports go stale. According to J.P. Morgan research, the longer a shutdown lasts, the harder it becomes to restart financial operations and reconcile accounts.
Logistics teams struggle to maintain visibility into supply chains, contracts, and procurement. Manual tracking systems can’t keep up when the people managing them aren’t working. Critical information gets lost. Vendors wait for answers. Projects stall.
The Value of Automation During Crisis
Automated data platforms solve these problems by removing the dependency on constant human intervention. These systems continue collecting, validating, and organizing data even when offices are understaffed.
Think about payroll processing. An automated system pulls time and attendance data, calculates pay, processes deductions, and generates reports without manual input. When HR staff are furloughed, the system keeps running. Employees still get paid on time. Benefits continue without interruption. When the shutdown ends, there’s no backlog to clear.
The same principle applies to financial operations. Automated data integration connects accounting systems, procurement platforms, and budget tracking tools. Transactions flow automatically. Reports update in real time. Finance teams can monitor spending and maintain compliance with skeleton crews.
For logistics, automation provides continuous visibility. Contract management systems track deadlines and deliverables. Inventory systems monitor stock levels. Procurement platforms maintain vendor relationships. These functions don’t pause when people do.
Three Pillars of Resilient Data Infrastructure
Building resilience requires more than just automation. Government agencies need data platforms built on three core principles.
Curation ensures data quality remains high regardless of staffing levels. Automated validation rules catch errors before they spread through systems. Standardized data formats make information easy to find and use. When operations resume after a shutdown, teams work with clean, reliable data instead of spending weeks fixing problems.
Governance maintains security and compliance during disruptions. Access controls protect sensitive information. Audit trails track every change. Approval workflows continue functioning even with reduced staff. These safeguards prevent the chaos that often follows a shutdown when agencies discover compliance gaps or security issues.
Integration connects systems across departments and functions. HR platforms talk to finance systems. Procurement tools share data with logistics. Budget tracking connects to spending analysis. This connectivity means information flows automatically instead of requiring people to manually transfer data between systems.
Measuring Recovery Time
The difference between manual and automated systems becomes obvious when measuring recovery time. Agencies using manual processes typically need three to four weeks to return to normal operations after a shutdown. They spend this time reconciling accounts, clearing backlogs, and fixing errors that accumulated during the disruption.
Agencies with automated data platforms recover in days instead of weeks. Their systems maintained data quality during the shutdown. Backlogs are minimal. Staff can focus on strategic work instead of administrative catch-up.
Function
Manual Process Recovery
Automated Platform Recovery
HR & Payroll
3-4 weeks
2-3 days
Financial Reporting
4-6 weeks
1 week
Contract Management
2-3 weeks
3-5 days
Budget Reconciliation
4-5 weeks
1-2 weeks
These time savings translate directly to cost savings. Less time spent on recovery means more time delivering services. Fewer errors mean less rework. Better data quality supports better decisions.
Building for the Next Disruption
Government shutdowns aren’t the only disruptions agencies face. Natural disasters, cybersecurity incidents, and public health emergencies create similar challenges. Automated data platforms provide resilience against all these scenarios.
The investment in data engineering and automation pays dividends every day, not just during crises. Staff spend less time on repetitive tasks. Leaders get better information faster. Agencies can redirect resources toward mission-critical work.
Starting this transformation doesn’t require replacing every system at once. Most agencies begin by automating their most manual processes. HR and finance functions offer quick wins because they involve repetitive tasks with clear rules. Success in these areas builds momentum for broader changes.
Working with experienced data analytics consultants helps agencies identify the right starting points and avoid common pitfalls. The goal isn’t technology for its own sake. The goal is building systems that keep working when everything else stops.
Moving Forward with Automation
The next shutdown will happen. The timing is uncertain, but the impact is predictable. Agencies that prepare now will maintain operations while others struggle. The difference comes down to infrastructure. Manual processes fail under pressure. Automated systems keep running.
Government leaders who invest in modern data platforms aren’t just preparing for shutdowns. They’re building the foundation for better service delivery, smarter resource allocation, and more effective operations every single day.
Whether you’re looking to automate HR processes, streamline financial reporting, or improve logistics visibility, our team can help you identify quick wins and build a roadmap for long-term resilience.
Schedule a consultation with our government data experts to discuss your specific challenges and discover how automated data platforms can transform your agency’s operations.
For IT leaders and cloud architects, scalability isn’t just about adding storage or compute—it’s about designing a data infastrucutre that can sustain velocity, variety, and volume without sacrificing performance, governance, or cost efficiency.
Most infrastructures that work in early stages eventually break under pressure: query latency spikes, pipelines slow, storage thresholds force hard data-retention decisions, and new integrations become brittle. This isn’t just an operational headache—it’s a systemic limitation that compromises data reliability and agility across the enterprise.
At Qlik, we see this every day: organizations that proactively design for scalability achieve not only data resilience, but the ability to expand analytics, machine learning, and real-time decisioning at enterprise scale.
Why Non-Scalable Data Architectures Fail
When data infrastructure isn’t built for scale, challenges multiply quickly:
Throughput bottlenecks – ETL jobs that run overnight now take days.
Data silos – Multiple ungoverned storage layers prevent reliable analytics.
Cost inefficiency – Ad hoc scaling without automation results in overspend.
Poor resiliency – Systems that stall or fail under peak workloads reduce trust in data.
For IT directors, the real cost here is not just performance degradation—it’s losing the ability
Core Principles for Scalable Enterprise Data Infrastructure
Technical leaders can insulate against these risks by designing around five fundamentals:
Elastic Compute + Storage – Native autoscaling for ingestion, transformation, and warehousing.
Decoupled Services – Avoid monoliths. Architect for loose coupling across ingestion, processing, storage, and analytics.
Pipeline Automation – Continuous integration and deployment (CI/CD) for analytics pipelines reduces manual operations while supporting rapid iteration.
Observability & Monitoring – Real-time metrics, lineage, and anomaly detection to pre-empt bottlenecks.
Economic Scalability – Design for TCO (total cost of ownership), not just uptime. Plan for the frameworks to evaluate trade-offs across providers.
👉 Arc Professional Services often helps organizations operationalize these principles through reference architectures, deployment accelerators, and governance frameworks across cloud and hybrid data ecosystems.
Reference Architectural Patterns
The building blocks of scalable infrastructure vary, but certain patterns consistently deliver at enterprise scale:
Cloud-Native Architectures – Managed elastic compute/storage (AWS, Azure, GCP) tailored via policies for autoscaling and failover. See our guide on Building a Cloud Data Strategy to align platform selection with scalability goals.
Distributed Systems – Leverage Spark/Dask for distributed compute, Kafka for real-time messaging, and distributed query engines (Presto, Trino) for federated analytics.
Microservices & APIs – Isolate high-throughput services (fraud detection, personalization) into independently scalable units; deploy via containers and Kubernetes orchestration.
Hybrid and Multi-Cloud Mesh – Where latency, regulatory, or locality requirements exist, Qlik’s integration solutions bridge on-premises and cloud-native stores into a cohesive fabric with data lineage and governance.
Technology Decisions That Drive Data Infrastructure at Scale
For IT decision makers, selecting the right scaling tools requires weighing trade-offs:
Storage – Object stores (S3, Blob, GCS) for scale-out economics; NoSQL DBs (Cassandra, MongoDB) for flexible schema and horizontal reads/writes; columnar/cloud warehouses (Snowflake, BigQuery, Redshift) for analytics concurrency.
Compute & Processing – Batch and micro-batch with Spark/Dask; streaming with Kafka + Flink; consider Kubernetes orchestration for elastic container scaling.
Data Movement & Integration – Use CDC (change data capture)–enabled pipelines for real-time data replication. This is where Qlik excels—providing low-latency ingestion with lineage and CDC at scale.
Visibility & Governance – Implement observability into every layer; Qlik solutions embed lineage and metadata management to avoid “black box” integrations.
📌 As Gartner notes in their Data Management Maturity Model, scalability isn’t just technology—it requires aligned governance, processes, and integration across the data lifecycle.
Scaling Strategies for IT Leaders
Scaling should be iterative and framed as a roadmap, not a single migration project. Consider these strategies:
Foundational First – Build around elastic storage/compute before layering complex processing systems.
Automation Everywhere – Autoscaling, IaC (Infrastructure as Code), CI/CD pipelines for ingestion and analytics.
Observability-Driven – Keep real-time monitoring/alerting across ingestion, storage throughput, query latency, and pipeline success rates.
Plan by Workload Models – Model current/future concurrency + workload shapes, not just raw data volume.
Continual Optimization Loop – Regular audits for both performance and cost.
🔧 Qlik’s Professional Services partner with IT leaders to design and operationalize scaling strategies—from elastic CDC pipelines to governed multi-cloud architectures. Our team ensures scalability paths are not only designed but also implemented with integration best practices.
Technical Scalability as a Business Enabler
For IT directors and cloud architects, scalable data infrastructure isn’t about keeping the lights on—it’s about enabling the organization to innovate, move fast, and trust its data under continuous growth.
By following proven architectural principles, choosing technologies designed for horizontal scale, and embedding governance + observability into every layer, you ensure that infrastructure doesn’t become tomorrow’s bottleneck.
With Qlik’s platform and services, enterprises can bridge cloud-native, hybrid, and distributed systems into a single governed fabric—delivering elastic scalability with integration and lineage built in.
That’s the difference between scaling infrastructure and scaling real business impact
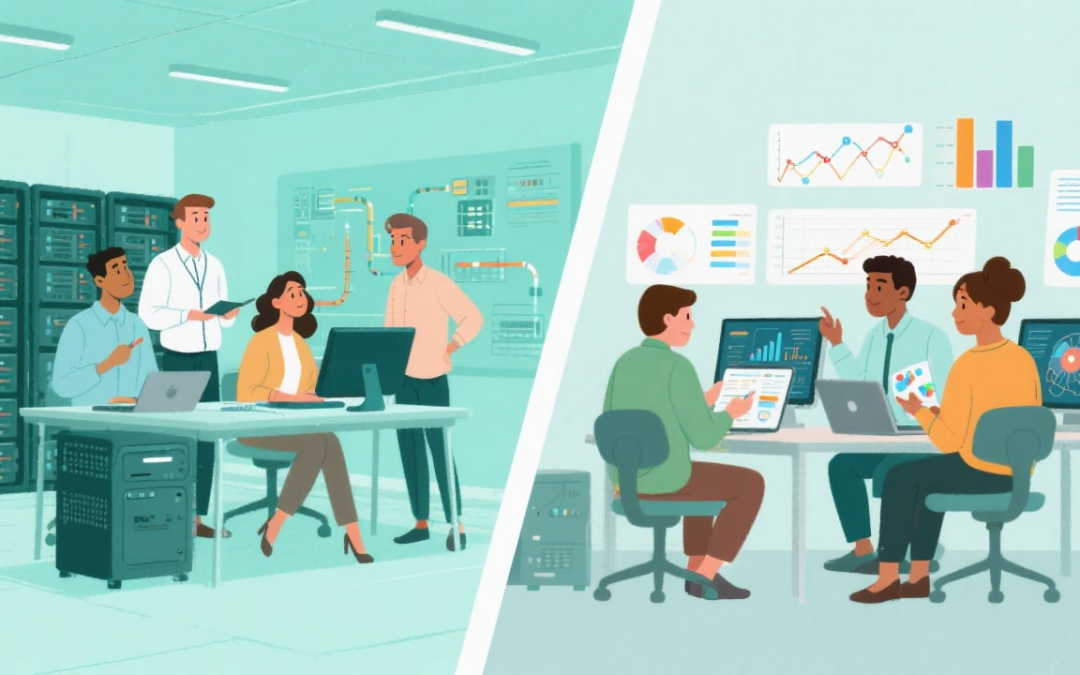
In today’s data-driven economy, businesses depend on skilled professionals to turn raw information into actionable insights. Two of the most critical roles are the data engineer and the data scientist. While these titles are often mentioned together, their responsibilities, skills, and day-to-day work differ significantly.
If you’re considering a career path — or trying to hire the right talent — understanding the difference between a data engineer vs. data scientist is essential.
What Does a Data Engineer Do?
Data engineers are the architects and builders of an organization’s data infrastructure. They design, construct, and maintain the pipelines, databases, and platforms that make clean, reliable data available for analytics and business intelligence.
Core Responsibilities of Data Engineers
Designing and maintaining data pipelines (ETL/ELT processes)
Building and managing data warehouses and data lakes
Ensuring data quality, consistency, and scalability
Implementing security measures to protect sensitive information
Optimizing data systems for performance, cost, and efficiency
Key Skills for Data Engineers
Strong programming in Python, SQL, and Scala
Expertise in databases (SQL & NoSQL)
Familiarity with cloud platforms (AWS, Azure, GCP)
👉 Explore more on how we help clients build scalable infrastructures in ourData Engineering Services page.
What Does a Data Scientist Do?
While engineers prepare the data, data scientists dive into it to uncover insights, predict outcomes, and inform decision-making. They apply statistics, machine learning, and AI to transform raw datasets into actionable intelligence.
Core Responsibilities of Data Scientists
Cleaning, exploring, and preparing data for modeling
Applying statistical analysis and machine learning algorithms
Building predictive and classification models
Visualizing complex results for technical and business audiences
Framing business problems as solvable data questions
Key Skills for Data Scientists
Strong background in math, statistics, and machine learning
Programming with Python, R, or Julia
Proficiency in visualization tools: Tableau, Power BI
Experience with ML libraries (scikit-learn, TensorFlow, PyTorch)
Ability to communicate business-ready recommendations
While different, these roles are deeply interconnected. Data engineers ensure high-quality foundations; data scientists transform that foundation into insights.
Which Career Path Is Right for You?
If you’re debating between becoming a data engineer or a data scientist, consider:
Do you enjoy building systems, solving infrastructure problems, and optimizing performance? → Data Engineering may be your fit.
Do you prefer analyzing data, applying models, and storytelling with insights? → Data Science might be your direction.
Both paths are in high demand and offer strong growth opportunities. For organizations, the best results come when both roles collaborate closely.
(Curious how we guide talent strategy? Read ourData Careers Guide for insights.)
What Comes First: Data Engineer or Data Science?
The reality is — data engineering usually comes first. Without well-structured, accessible data, even the most advanced science and modeling will fail.
Think of it like constructing a building: you wouldn’t hire interior designers before architects and builders lay a solid foundation. Similarly, no data science project succeeds without a trusted, scalable infrastructure in place.
👉 This is why many companies start by investing inModern Data Infrastructure before scaling analytics initiatives.
Future of Data Roles
Both roles are evolving with emerging technologies:
Data Engineers: Focus on cloud-native architectures, data governance, and security
Data Scientists: Sharpen expertise in deep learning, natural language processing (NLP), and explainable AI
Automation tools are accelerating workflows, but the demand for human expertise in designing systems and interpreting results will only grow.
Organizations that foster close collaboration between these two functions will be best positioned to leverage AI and data for competitive advantage.
For more perspectives on where business data is heading, check out our recent post onThe Future of AI in Business.
Forward Thinking
The distinction between data engineers and data scientists isn’t about competition — it’s about collaboration. Together, they form the backbone of any modern data team.
Businesses that want to succeed in the data economy must invest in both infrastructure (engineering) and analytics (science). For individuals, both career paths offer rewarding opportunities to shape the future of how organizations harness information.
Frequently Asked Questions (FAQ)
Is data engineering harder than data science?
Not necessarily. Data engineering leans heavily on programming, system design, and cloud infrastructure, while data science requires a deep understanding of math, statistics, and modeling. The difficulty depends on your background and interests.
Who earns more: Data engineer or data scientist?
Salaries vary by industry and experience, but historically data scientists earn slightly higher median salaries due to their specialization in machine learning and AI. However, demand for data engineers is rising quickly as companies recognize the importance of solid infrastructure.
Do you need data engineering before data science?
Yes. Without a reliable and scalable data infrastructure, data scientists cannot work effectively. That’s why many organizations invest in data engineering first, then scale into analytics and advanced modeling.
Which career path should I choose?
If you enjoy building systems, working with databases, and solving infrastructure problems, pursue data engineering. If you’re more interested in analytics, machine learning, and storytelling with data, consider data science. Both fields are in high demand.
Are data engineers and data scientists replacing each other?
No — these are complementary roles. Data engineers build the foundation, while data scientists analyze and interpret the data. Together, they drive data-driven decision-making.
About Blog
Arc Analytics is a full-service data analytics and integration consultancy based in Charlotte, NC, USA, specializing in the Qlik platform. Browse the posts below for practical Qlik tips, migration guidance, and real-world use cases from our consulting work.