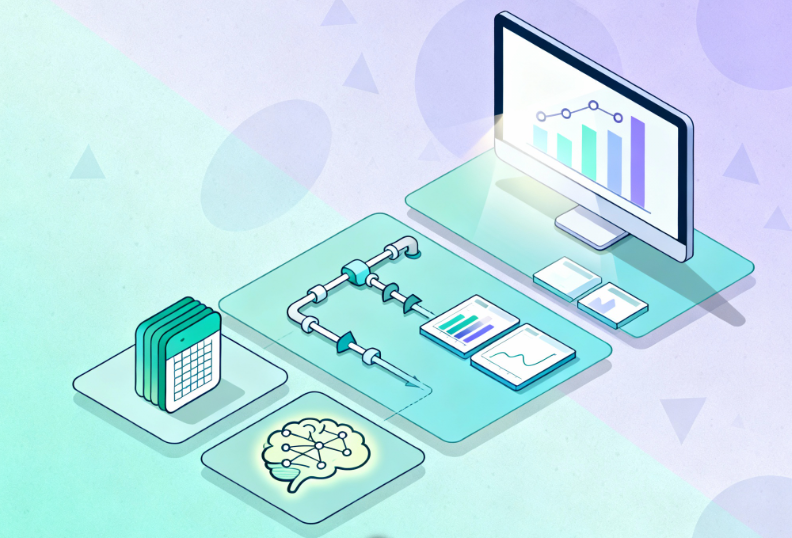
How The New AI Alliances Impact Your Readiness
The fastest news in tech right now is not a new tool. It is the pace of large vendors partnering to bring compute, software, and services together in one place. Oracle is deepening its work with Nvidia. Google is doing the same. These moves change how quickly teams can move from a pilot to production AI Alliances. This article explains what is new, why it matters, and where Arc Analytics fits. For a view of our services, start here: Arc Analytics Services.
What is actually new within the AI Alliances?
Oracle and Nvidia are making Nvidia’s software stack available inside the Oracle Cloud console. Teams can select optimized services, spin up tested recipes, and connect to database features that now support search on vectors. Oracle also signals that the next wave of chips will be available across its regions, with larger clusters and faster links.
Google and Nvidia continue to align on hardware, training frameworks, and content checks. Workloads built with familiar open source tools run more efficiently on Nvidia hardware in Google Cloud. There is also progress on watermarking of generated content to help track sources.
Oracle is also partnering with AMD. This matters because it widens choice and can reduce wait times for capacity. It also encourages teams to design for more than one type of chip from the start.
Why this matters to buyers
These alliances shorten the time between an idea and a live service. You get curated building blocks inside the cloud consoles, tested reference paths, and simpler billing. You also get clearer choices for sensitive workloads, since sovereign and government regions are part of the story. The tradeoff is that capacity planning and cost control matter more than ever. You will want a plan that can move across vendors, across chip families, and across regions without a redesign.
Foundation first
Speed only helps if your basics are solid. Most projects stall because data is scattered, definitions are unclear, and access rules are loose. Before you ride the wave of new services, put the ground in order.
- Centralize the highest value domains and automate the refresh.
- Write down how core metrics are calculated and publish them.
- Set ownership for data quality, access, and change control.
For help with the groundwork, see our pages on Data Services, Business Intelligence, and Data Governance.
What the AI Alliances can change in the next 6 to 12 months
- Procurement moves earlier. Reservation windows and capacity queues will shape timelines.
- Architecture needs portability. Design for multiple chip options and containerized runtimes that can shift without code rewrites.
- Search moves into the database. Features for vector search inside Oracle Database reduce custom glue code.
- Content checks are becoming table stakes. Watermarking and traceability will show up in reviews and audits.
Where each alliance fits
| Scenario | Why it helps | What to check |
| Regulated or sovereign workloads | Oracle with Nvidia offers regions and controls that match strict rules | Residency needs, review cycles, audit trails |
| Fast pilot to production on Nvidia stack | Recipes and ready services in the Oracle console speed delivery | Latency targets, cost caps, on-call readiness |
| Open source training and research | Google with Nvidia optimizes common frameworks at scale | Framework fit, training time, data egress |
| Price and capacity flexibility | Oracle partnering with both Nvidia and AMD widens options | Queue times, chip mix, contract terms |
How Arc Analytics turns AI Alliances into outcomes
Platform and workload fit
We compare Oracle Cloud, Google Cloud, and hybrid layouts for your use cases. You receive a reference design, cost model, and a plan for capacity.
Data readiness and modeling
We connect sources, model core tables, set refresh schedules, and prepare search features using vectors when needed. See our Data Services page for the full scope.
Deployment engineering
We stand up containerized services, wire run logs and alerts, and create simple rollbacks. If your reporting layer runs on Qlik, we also connect models to dashboards. See Qlik Services.
Governance and risk
We define roles, access, and change control. We document metric logic, lineage, and review steps. See Data Governance.
Staffing support
When you need extra hands, we provide architects, data engineers, and analysts. See Staffing.
A practical 90-day plan for your own AI Alliances
| Phase | Timeline | Key Activities | Value Delivered |
| Assess and align | Days 0 to 30 | Map current systems and data flows. Select one high value use case. Draft target architecture across Oracle, Google, or hybrid. | Stakeholder alignment on priority use case. Reference design with portability. Initial cost model. |
| Build the core | Days 31 to 60 | Centralize core data sets with automated refresh. Publish metric definitions and tests. Reserve capacity and prepare runtime environments. | Live data foundation with passing tests. Published data dictionary. Capacity secured and cluster ready. |
| Ship and benchmark | Days 61 to 90 | Deploy one production workflow with monitoring and rollback. Benchmark cost and performance across two vendor options. Publish access model and governance checklist. | Production use case live with SLOs. Cost per query tracked. Benchmark report across vendors. Governance in place. |
What good looks like at day 90
| Area | Outcome | Proof |
| Live workflow | One production use case with support coverage | SLO dashboard and on-call rotation |
| Data clarity | Shared metric logic and dictionary | Public page with version history |
| Cost and capacity | Monthly report on cost per query and queue times | Benchmarks across at least two vendor options |
| Governance | Access roles and change log in place | Review notes and approvals |
How the AI Alliances Position You
You gain a clean base, clear definitions, and a small set of live services that prove value. You also gain a design that can shift across vendors without starting over. This reduces risk when prices move or when a region fills. It also prepares you to use new features faster, since your data and models are already in order.
Where Arc Analytics Adds Value
- We keep current on vendor moves, so your plan reflects the latest choices from Oracle, Nvidia, Google, and AMD.
- We translate news into a design you can run. Our focus is the pipeline, the model logic, the access rules, and the dashboard that the business trusts.
- We help you avoid narrow choices that lead to lock in. From the start, we design for portability across chips, regions, and clouds.
News you can trust on AI Alliances
- Oracle and Nvidia integration announcement: Oracle Newsroom and Nvidia Newsroom
- Oracle’s multi chip posture with Nvidia and AMD: CIO Dive coverage
- Google and Nvidia collaboration summary: Technology Magazine
What now?
If you want a plan that fits your business and takes advantage of these alliances without locking you in, start with a short assessment. You will get a readiness score, a target design, and a cost view you can share with leadership. Contact us at Arc Analytics.