Qlik doesn’t really allow for icons. When creating dashboards in Qlik Cloud, it can be very helpful to add icons to spruce up KPIs, titles, and tables. There are hundreds of use cases for adding some visual flair using icons, but it can be cumbersome to add icons to objects in Qlik because there are very few built-in icon options.
So, how can we go about adding some icons to our dashboards in an easy and expressive way?
We can use a font! But wait, we’re talking about icons, not text. So how will a font help us? It turns out that fonts can pack in far more than just standard characters like letters, numbers, and punctuation. One example of a “supercharged” font is Tabler Icons.
Tabler Icons is an open source project that bundles thousands of beautiful icons into multiple formats that you can use freely in your web projects. One such format is a webfont, specifically .tff which is a TrueType font type.
How can we use this font in Qlik?
We’ll add it to a custom Qlik theme and choose icons in our dashboard using variable expansion with a parameter.
Don’t worry if this doesn’t quite make sense yet! Let’s go through each step now.
Steps to set up
Download Tabler Icon webfont.
We can find the tabler-icons.ttf font file in the Tabler Icons Webfont package on the NPM website:
If you don’t already have a custom theme to add this font to, go ahead and create one based on the instructions laid out on the Qlik Help website. You can also look online for a Qlik theme generator to help get you started.
Add tabler-icons.ttf to the Qlik theme folder.
Move the tabler-icons.ttf file to your custom Qlik theme folder. It should look similar to this:
Add @font-face to the theme CSS file.
Open your theme’s .css file and add this snippet at the top:
ℹ️ Note that in our screenshot above, my snippet includes the Open Sans font, as I want for that to be the primary font for normal characters like letters and numbers. You can replace that with any of the default Qlik Cloud font options:
Upload file to Qlik Cloud or Qlik Sense Client-Managed.
To add your custom theme to Qlik, you must first save the theme folder as a ZIP file.
In the box that appears, click on the hex value to copy it:
Go to the app Sheet view and switch the app theme to use our uploaded theme.
In your Qlik app, select any Qlik object, and then choose an expression property.
For example, you can create or select a bar chart object and then open the expression editor for the Title expression.
In the property’s expression editor, we’ll use dollar-sign expansion with our GetTablerIcon variable and use the our copied Tabler Icon hex code as the parameter.
Make this the expression:
=$(GetTablerIcon(ea59)) & ' Sales by County'
– Then select the Apply button to save that.
You should now see your icon in the chart title!
If your icon doesn’t appear or you see a placeholder character in the chart title where our icon should be, you probably just need to update the font property.
To do this, go to the chart styling tab:
Find the font property we want to change (Title in this example) and then choose the option that includes Tabler Icons:
ℹ️ Note that if you want to “pair” the Tabler Icons font with a primary font that regular characters will use, refer back to step 5.
Summary
You should now be able to use Tabler Icons anywhere in a Qlik dashboard that supports text expressions and changing the font!
That should get you very far.Try changing the font color and size to see how the icons scale very well and can be recolored just like text.
While the Qlik platform has maintained and supported libraries developer libraries in JavaScript and .NET/C# for several years, they have more recently released a library for interacting with Qlik in Python. They call it the Platform SDK, which is also available as a TypeScript library.
The Python library is essentially a set of Python classes and methods that mirror the structures and functions of the Qlik QRS and Engine APIs, also providing some conveniences around authentication and WebSocket connections. The library is open for anyone to download and use thanks to its permissive MIT license.
The use cases for the Qlik Python SDK include being able to write automation scripts for repetitive admin tasks, load app and object data into a Pandas dataframe, and even creating reports built off of app or log data.
Installing the library is very simple — just make sure you are using at least Python 3.8:
python3 -m pip install --upgrade qlik-sdk
Let’s look at some examples of how we can use the library. Below, we import a few classes from the qlik_sdk library and then create some variables to hold our Qlik Cloud tenant URL and API key. We’ll use the API key to authenticate with a bearer token but an OAuth2.0 implementation is also available. Learn how to generate an API key here. The tenant URL and API key are then used to create an Apps object, which provides some high-level methods for interacting with app documents in Qlik Cloud.
from qlik_sdk import Apps, AuthType, Config# connect to Qlik enginebase_url ="https://your-tenant.us.qlikcloud.com/"api_key ="xxxxxx"apps = Apps(Config(host=base_url, auth_type=AuthType.APIKey, api_key=api_key))
Now that we’ve got our authentication situated, let’s add some code to interact with a Qlik app and its contents. First, let’s import a new class, NxPage, which describes a hypercube page (more about Qlik hypercubes here). Then let’s create a new function, get_qlik_obj_data(), to define the steps for getting data from a Qlik object, like a table or bar chart. In this function, we can take an app parameter and an obj_id parameter to open an WebSocket connection to the specified app, get the app layout, get the size of the object’s hypercube, and then fetch the data for that hypercube:
from qlik_sdk.apis.Qix import NxPageapp = apps.get("xxxxxxxx-xxxx-xxxx-xxxx-xxxxxxxxxxxx")def get_qlik_obj_data(app: NxApp, obj_id: str) ->list:"""Get data from an object in a Qlik app."""# opens a websocket connection against the Engine API and gets the app hypercubewith app.open(): tbl_obj = app.get_object(obj_id) tbl_layout = tbl_obj.get_layout() tbl_size = tbl_layout.qHyperCube.qSize tbl_hc = tbl_obj.get_hyper_cube_data("/qHyperCubeDef", [NxPage(qHeight=tbl_size.qcy, qWidth=tbl_size.qcx, qLeft=0, qTop=0)], )return tbl_hcobj_data = get_qlik_obj_data(app=app, obj_id="xxxxxx")
This code would end up returning a list of data pages, something like this:
The cell value is shown as 282 in the qText property. We may note, though, that we can’t readily identify the field that this value represents.
Let’s add some code to make the resulting dataset include the fields for each cell value. We can do that by adding a get_ordered_cols_qlik_hc() function to get the ordered list of columns in each of these NxCellRows items.
This function will ultimately take a straight hypercube as an argument and do the following:
Get the list of dimensions and measures and then combine them into one list.
Reorder that list to match the correct column order as defined in the hypercube’s qColumnOrder property.
Return that ordered column list.
Then in our get_qlik_obj_data() function, we use our new get_ordered_cols_qlik_hc() function to get our columns. From there we iterate through each row of each data page in the hypercube and create a new dictionary object for each cell and then adding those dictionaries to a list for each row.
New and updated code shown in bold:
from qlik_sdk.apis.Qix import NxPage, HyperCubedef get_ordered_cols_qlik_hc(hc: HyperCube) ->list:"""get ordered columns from Qlik hypercube."""# get object columns dim_names = [d.qFallbackTitle for d in hc.qDimensionInfo] meas_names = [m.qFallbackTitle for m in hc.qMeasureInfo] obj_cols = dim_names.copy() obj_cols.extend(meas_names)# order column array to match hypercube column order new_cols = [] new_col_order = hc.qColumnOrderfor c in new_col_order: new_cols.append(obj_cols[c])return new_colsdef get_qlik_obj_data(app: NxApp, obj_id: str) ->list:""""""# opens a websocket connection against the Engine API and gets the app hypercubewith app.open(): tbl_obj = app.get_object(obj_id) tbl_layout = tbl_obj.get_layout() tbl_size = tbl_layout.qHyperCube.qSize tbl_hc = tbl_obj.get_hyper_cube_data("/qHyperCubeDef", [NxPage(qHeight=tbl_size.qcy, qWidth=tbl_size.qcx, qLeft=0, qTop=0)], ) hc_cols = get_ordered_cols_qlik_hc(tbl_layout.qHyperCube)# traverse data pages and store dict for each row hc_cols_count =len(hc_cols) tbl_data = []for data_page in tbl_hc:for rows in data_page.qMatrix: row = {hc_cols[i]: rows[i].qText for i inrange(hc_cols_count)} tbl_data.append(row)return tbl_dataobj_data = get_qlik_obj_data(app=app, obj_id="xxxxxx")
This will get us the desired field: value format that will allow us to better analyze the output, like so:
One of the toughest aspects of dealing with freeform data is that the input layer may not have proper data validation processes to ensure data cleanliness. This can result in very ugly records, including non-text fields that are riddled with incorrectly formatted values.
Take this example dataset:
[Test Data] table
RecordID
DurationField
1
00:24:00
2
00:22:56
3
00:54
4
0:30
5
01
6
4
7
2:44
8
5 MINUTES
9
6/19
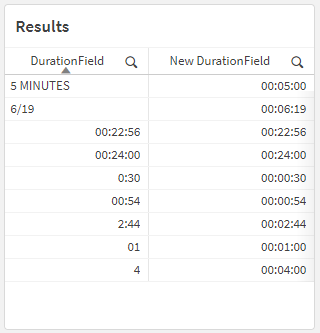
Those values in the [DurationField] column are all different! How would we be able to consistently interpret this field as having a Interval data type?
One of the ways you might be inclined to handle something like this is to use If() statements. Let’s see an example of that now.
It’s a mess! Qlik has to evaluate each Interval#() function twice in order to, first, check to see if the value was properly interpreted as a duration (“interval”) value, and then, second, to actually return the interpreted duration value itself.
One of the nice alternative ways of handling this is to use a different conditional function, like Alt(). This function achieves the same thing as using the If() and IsNum() functions in conjunction. You can use:
The preceding load happening at the bottom of that script is there to do some basic standardization of the [DurationField] field so that it’s easier to pattern-match.
In the rest of the script, we’re using the Alt() function (Qlik Help page) to check whether its arguments are numeric type of not. Each of its arguments are Interval#() functions, which are trying to interpret the values of the [DurationField] field as the provided format, like 'hh:mm:ss' or 'm:s'.
So it’s basically saying:
If Interval#([DurationField], 'hh:mm:ss') returns a value interpreted as an Interval, then return that value (for example, 00:24:00). But if a value couldn’t be interpreted as an Interval (like 5 mins for example, where the Interval#() function would return a text type), we go to the next Interval#() function. If Interval#([DurationField], 'mm:ss') returns a value…
This should all result in a table that looks like this:
In this post, I want to look at how to use a few of the built-in Qlik GeoAnalytics functions that will allow us to manipulate and aggregate geographic data.
Specifically, we are going to look at how to calculate a bounding box for several grouped geographic points, reformat the result, and then calculate the centroid of those bounding boxes. This can be a useful transformation step when our data has geographic coordinates that you need to have aggregated into a single, centered point for a particular grouping.
In our example, we have a small dataset with a few records pertaining to Florida locations. It includes coordinates for each Zip Code that is within the city of Brandon. Our goal is to take those four coordinates, aggregate them into a single, centered point, and then return that point in the correct format for displaying it in a Qlik map object.
Here’s our data, loaded from an Inline table:
[Data]:
Load * Inline [
State   ,   County          ,   City            ,   Zip     ,   Lat         ,   Long
FL      ,   Hillsborough    ,   Apollo Beach    ,   33572   ,   27.770687   ,   -82.399753
FL      ,   Hillsborough    ,   Brandon         ,   33508   ,   27.893594   ,   -82.273524
FL      ,   Hillsborough    ,   Brandon         ,   33509   ,   27.934039   ,   -82.302518
FL      ,   Hillsborough    ,   Brandon         ,   33510   ,   27.955670   ,   -82.300662
FL      ,   Hillsborough    ,   Brandon         ,   33511   ,   27.909390   ,   -82.292292
FL      ,   Hillsborough    ,   Sun City        ,   33586   ,   27.674490   ,   -82.480954
];
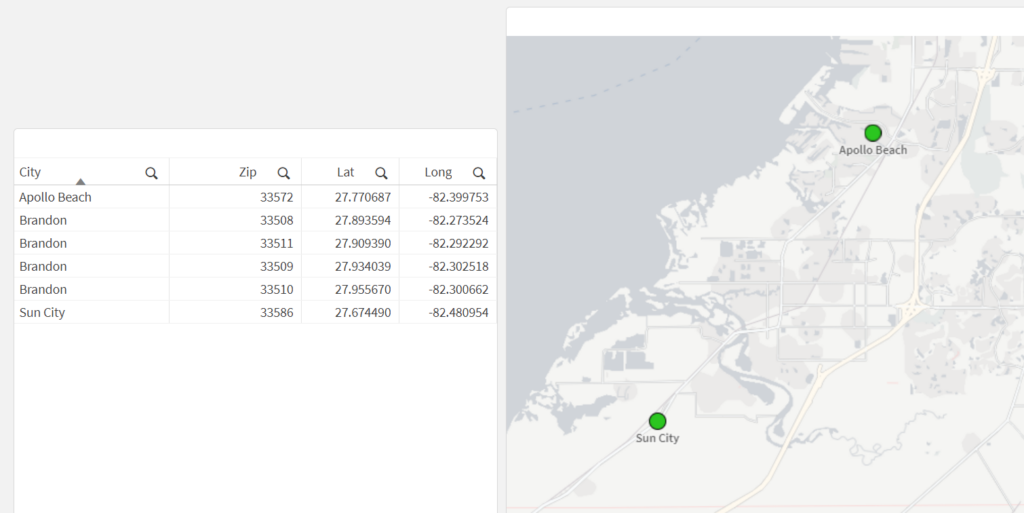
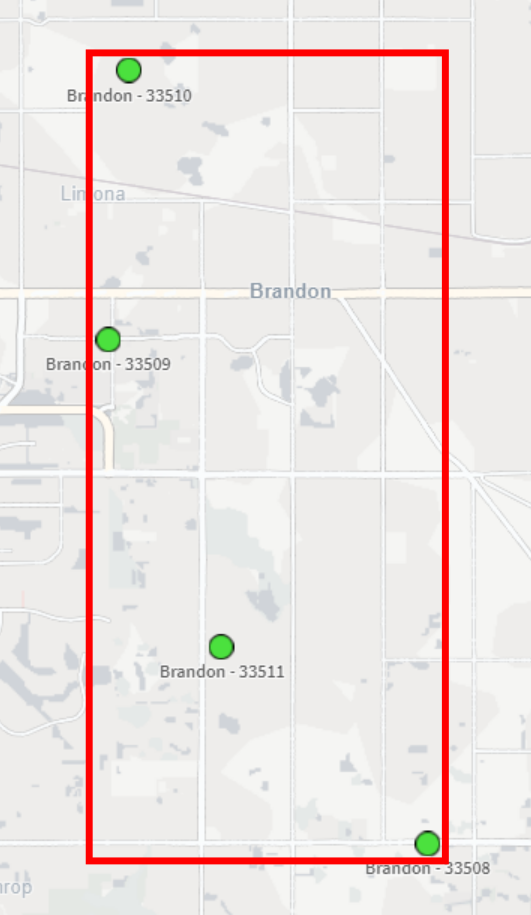
Let’s see what happens when we load this data and create a new map that has a point layer, using City as the dimension and the Lat/Long fields as the location fields:
What we may notice here is that the city of Brandon does not show up on the map — this is because the dimensional values for the point layer need to have only one possible location (in this case, one lat/long pair). Since Brandon has multiple Lat/Long pairs (one for each Zip Code), the map can’t display a single point for Brandon.
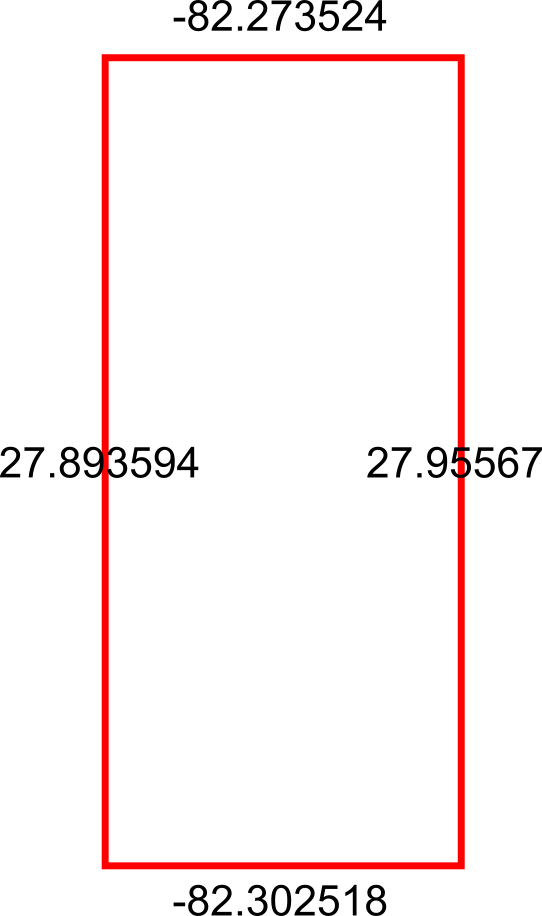
Okay, so let’s get the bounding box so that we can use it to get the center-most point. This is ultimately what we want our bounding box to be:
To do this in Qlik we’ll use the GeoBoundingBox() function, which calculates the smallest possible box that contains all given points, as shown in the example image above.
Here’s the script we can use in the Data Load Editor:
[Bounding Boxes]:
Load
    [City]
  , GeoBoundingBox('[' & Lat & ',' & Long & ']') as Box
Resident [Data]
  Group By [City]
;
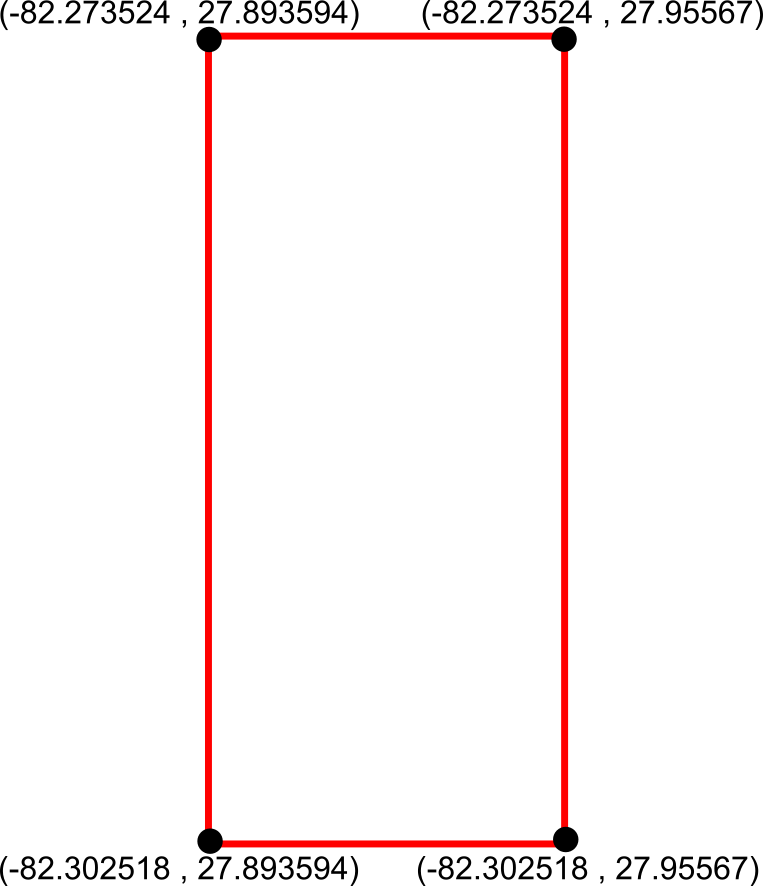
Alright so we now have our bounding boxes for our cities, but we can’t use those points quite yet — right now we just have the top, left, right, and bottom points separately:
What we need to do is reformat those points into actual coordinates for the bounding box, like so:
We can achieve this by using the JsonGet() function, which can return values for specific properties of a valid JSON string. This is useful to us because the GeoBoundingBox() function we used before returns the top, left, right, and bottom points in a JSON-like string that we can easily parse for this step.
Here’s the Qlik script we can use to parse those points into actual coordinates:
So now that we have these coordinates, we can aggregate the box coordinates into a center point using the GeoGetPolygonCenter() function, which will take the given area and output a centered point coordinate.
Here’s the script we can use for this:
[Centered Placenames]:
Load *
  , KeepChar(SubField([City Centroid], ',', 1), '0123456789.-') as [City Centroid Long]
  , KeepChar(SubField([City Centroid], ',', 2), '0123456789.-') as [City Centroid Lat]
;
Load
    [City]
  , GeoGetPolygonCenter([Box Formatted]) as [City Centroid]
Resident [Formatted Box];

Drop Table [Formatted Box];
This will result in the center points for each city. We also split out the Lat/Long fields into separate fields for easier use in the map:
City
City Centroid
City Centroid Lat
City Centroid Longitude
Apollo Beach
[-82.399753,27.770687]
27.770687
-82.399753
Brandon
[-82.288021,27.9094739069767]
27.9094739069767
-82.288021
Sun City
[-82.480954,27.67449]
27.67449
-82.480954
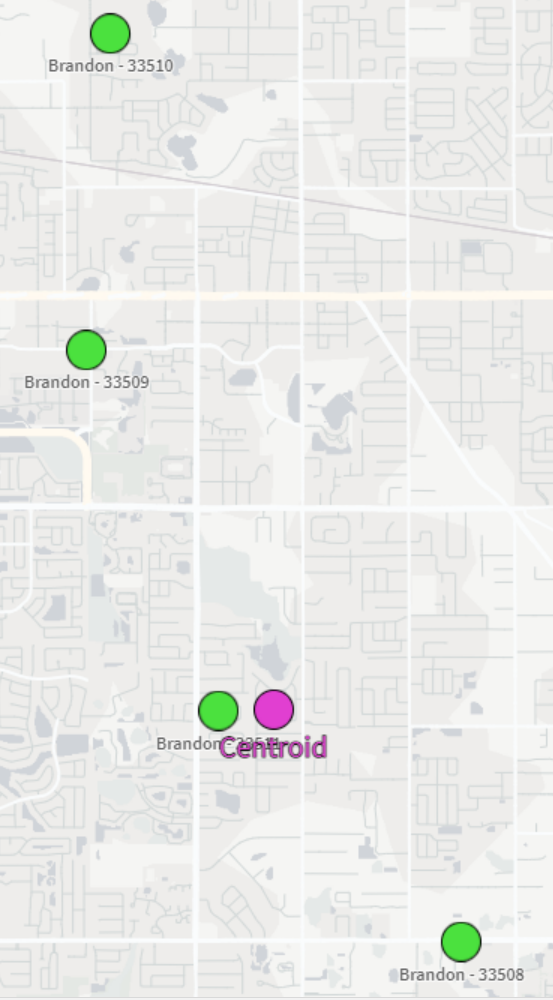
And now we can view our city-centered points on a map:
And there we have it! It’s not the perfect centering we may have expected but that could be due to the map projection that we’re using or the specificity of the coordinates we chose. Either way, this is a great way to be able to aggregate several coordinates down to their center point.
One of the most-utilized features of web browsers is the bookmark; everyone has their favorite sites saved for later, but that’s really their only function – to navigate you. What if you wanted to have a bookmark that, instead of simply taking you to another webpage, could dynamically make changes to the page you’re currently on? You may be thinking, “oh, you mean browser extensions?” Yes, those absolutely fall into that category of functionality and purpose, but here’s a special type of bookmark you may not have known about: the JavaScript bookmarklet.
A JavaScript bookmarklet is a browser bookmark that runs JavaScript code instead of just navigating you to a webpage. They start with the javascript: quasi-protocol rather than the usual http:// or https:// protocol that we’re used to seeing. These bookmarkets are created the same way you create regular bookmarks and also live in your bookmark bar or folders.
I’ve written a few bookmarklets to make a couple of repetitive or annoying Qlik tasks easier. Let’s look at one of my favorites.
Opening an app from the QMC
If you’re a Qlik Sense on Windows poweruser like me, then you live both in the QMC and the Hub. For tasks that involve me duplicating other developers’ apps, finding and opening generically-named apps, or opening apps where I have access to the app but not the stream, the usual way I’ve accessed those apps is to just copy/paste an already-opened app’s URL and then copy/paste in the new app’s AppID.
Enter this handy little bookmarklet: all you have to do is select a table row in the Apps section of the QMC and then click on the bookmark and it will automatically open the selected app in a new tab!
Below is the full, annotated code for this bookmark, as well as a compressed, shortened version:
How do I make this a bookmark in my browser?
Below are the steps for adding this as a bookmark in your browser — note that I am using the Brave browser, which has similar settings as Google Chrome and Microsoft Edge. If the instructions don’t match the browser that you’re using, do a quick web search on how to add a bookmark to your browser. You should be able to pick it up at step 3 below.
Select your browser’s main pane, find the Bookmarks option, and then select the Bookmark manager option.
Find the menu button and select the Add new bookmark option.
Name the bookmark Open app from QMC.
In the URL field, type in javascript:.
Go to the second code chunk from above (the one with only one line), select all of the text, copy it, and then paste it into the URL field next to where you typed javascript: in the bookmark page.
After you hit the Save button shown in the above GIF, your new bookmarket should be ready to use!
Arc Analytics is a full-service data analytics and integration consultancy based in Charlotte, NC, USA, specializing in the Qlik platform. Browse the posts below for practical Qlik tips, migration guidance, and real-world use cases from our consulting work.


")


")